
Bitcoin full node and query server
Jul 6, 2025
View in context in the libbitcoin Slack #general mirror.

Rowan Voskuil04:43
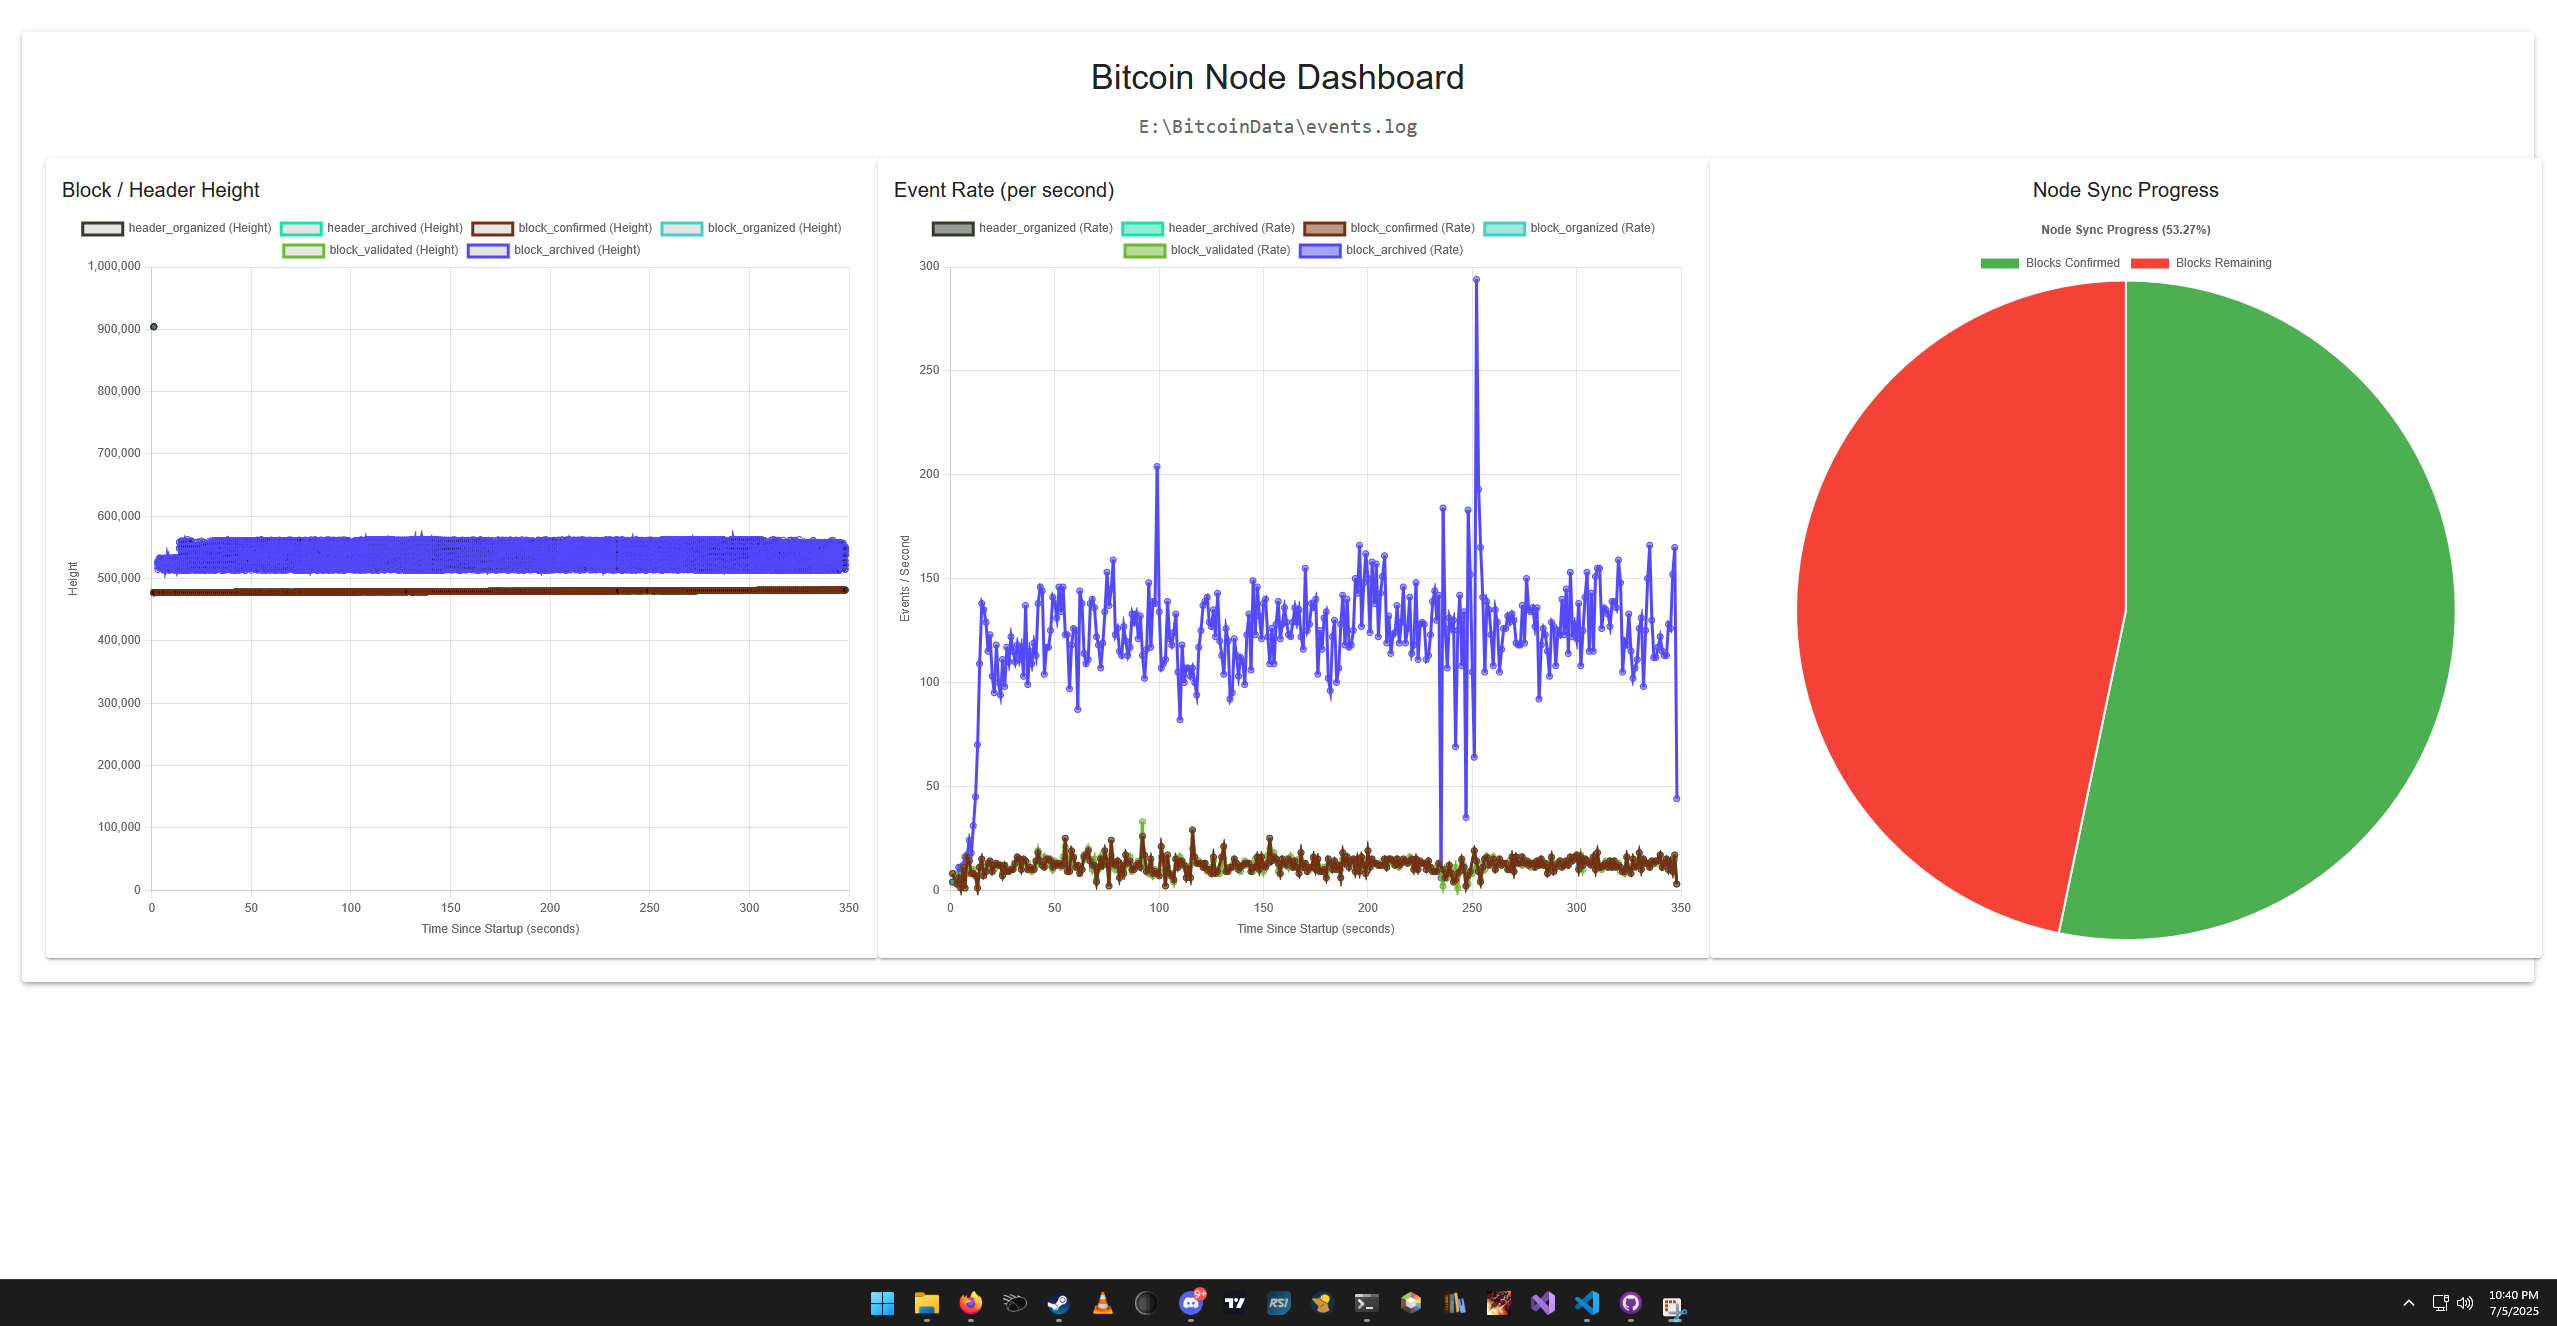
I have made some progress on the dashboard. The graphs are a bit messy. But it now has a pie chart to display the percent completion of the sync.
🚀 1
7 replies · neillm, Rowan Voskuil, evoskuil · last Jul 07, 2025

Rowan Voskuil16:56
No im getting the data from the event.log file for now. In the future the data will be directly sent from the node via websockets to the dashboard.
👍 1👍🏻 1

evoskuil05:16
This is looking really good Rowan.
I think it would be worth splitting the header events into their own plots, since these are so rapid initially, and so infrequent later, that they get completely buried the block plots.
Also, it might be interesting to see downloaded and validated blocks in the pie chart. Downloaded will always be <= to validated which is always <= confirmed. But unlike confirmed, these are not sequential. You would have to maintain a count. That would be fine unless the node is restarted with partial completions of download/validate, since you wouldn't have an accurate count. But it's also the case that a validated block implies that all blocks up to that height are downloaded, and a confirmed block implies all blocks up to that point are validated. So you could correct quickly.
evoskuil05:40
Correction. Downloaded can be any amount ahead of validated (up to the window size), and validated can be any amount ahead of confirmed. Not <=. But the rest is correct.
Rowan Voskuil22:06
You are able to deselect any event that you don't want to see on the graph and the graph will resize to fit the data. Do you still think it is worth it to make a separate graph. Because the way I see It most of the time the user would just keep those deselected and when they are interested in that data they can select it. But I can totally see wanting them to just exist in a separate graph if that is what you think is best and would be easy to change.
evoskuil22:12
Ah, just leave that it's good. Does the plot continue to scroll right, and is there a way to scroll back or scale the x axis so that earlier periods can be observed?