
Bitcoin full node and query server
Jan 7, 2025
View in context in the libbitcoin Slack #general mirror.
37 replies · evoskuil, pmienk, cguida · last Jan 08, 2025

evoskuil19:55
Yeah, pref shorter. The tool is called tracy, maybe
--tracer. I'm not sure what works yet, but might be nice to pull and build it and just have it integrated into vscode ux.
pmienk19:56
maybe
--with-tracy just to follow our dependency pattern? wouldn't really matter but then in the code the flag would be pretty clear and consistent👍🏻 1
evoskuil20:06
It's not a dependency though, it's a tool that's applied at the test or console project (I think). The VS profiling tools don't require any source instrumentation, but I think Tracy does require a symbol defined in the sources.
pmienk20:09
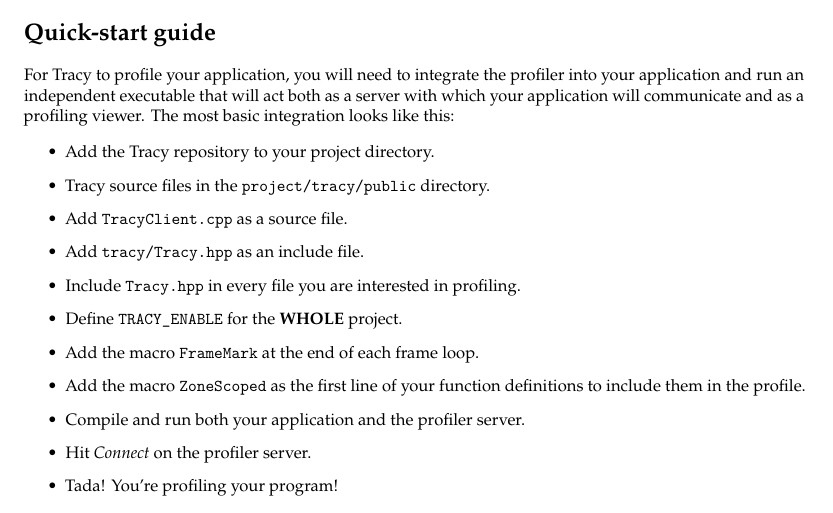
"Add the macro ZoneScoped as the first line of your function definitions to include them in the profile"
evoskuil20:11
I read on it and I thought that they had said the instrumentation was one include and that's it.
evoskuil20:12
Adding a macro to every function is a ridiculous way to discover performance hotspots.
(edited)evoskuil20:14
In the VS profiler it doesn't require a debug build, we can attach to the running process remotely, and there is no source instrumentation.
evoskuil20:20
There's a good tool integrated with xcode. Otherwise this one is the only other I found outside of VS.
C
cguida02:16
I watched a bit of the video linked on their github and the guy does a whole walkthrough on it
C
cguida02:20
https://libbitcoin.slack.com/archives/C6LH74ACQ/p1736282118292719?thread_ts=1736278617.939899&cid=C6LH74ACQ
it definitely affects performance, but i think the idea is we wouldn't build it in unless the
--with-tracy option were included
it claims to be "low overhead" fwiw, but yeah this is a debugging toolEric Voskuil
It's hard to imagine however that this won't affect performance.
C
cguida02:32
Presumably I can just throw it in something super high-level like
main() or something? Haha