
Bitcoin full node and query server
Jan 16, 2025
View in context in the libbitcoin Slack #general mirror.
15 replies · evoskuil, cguida · last Jan 16, 2025
C
cguida15:36
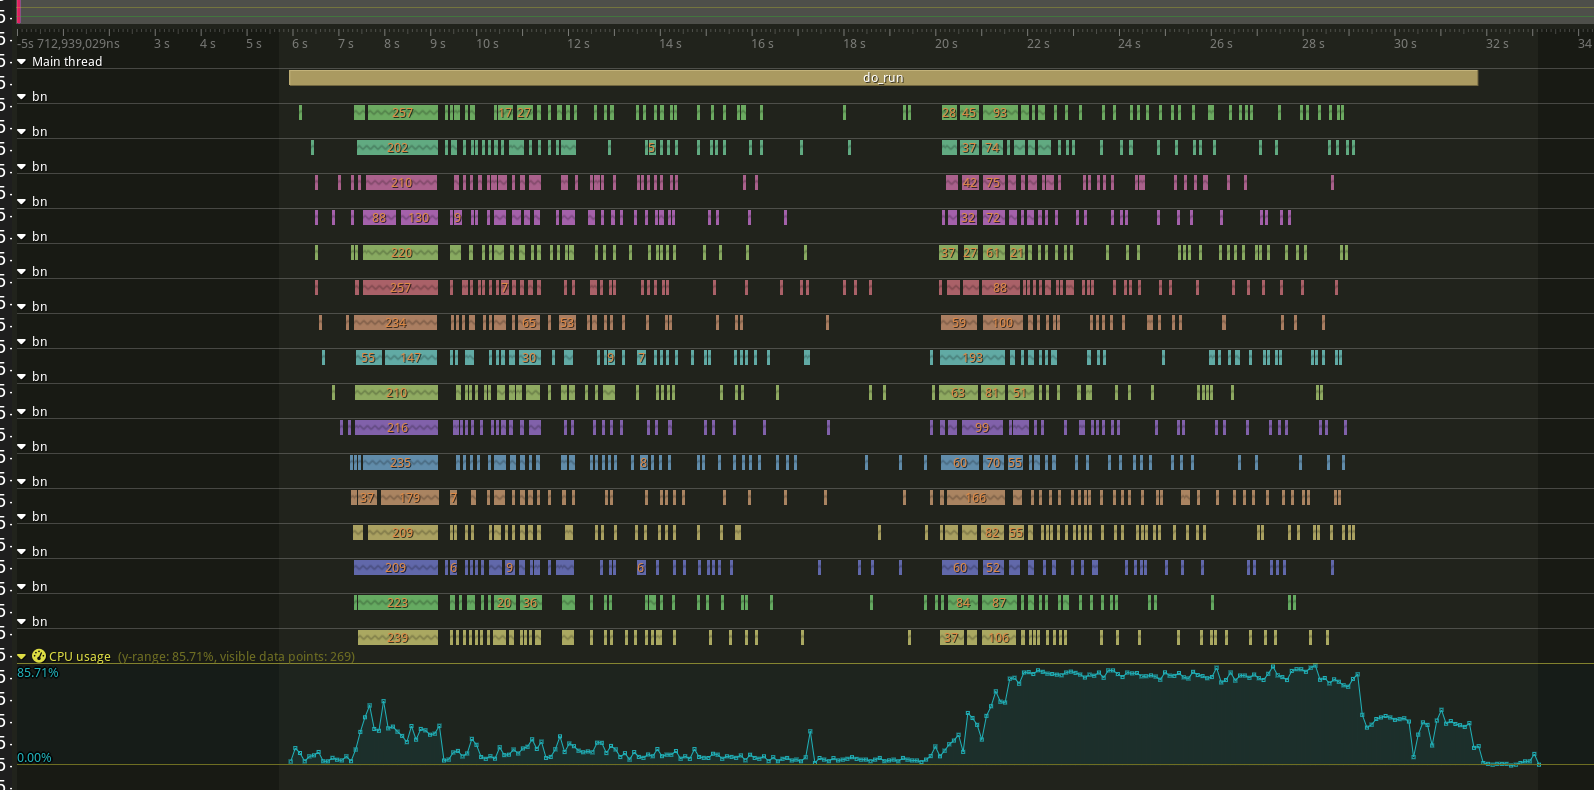
Do you have an suggestions for scopes to add to the profiler? The tutorial suggests a function that gets called 100 million times



evoskuil16:07
Many things get called billions of times. But that’s prob not even the issue, since cpu utilization is very low.
evoskuil17:51
Next step is just to figure out where it’s spending 90% of its time. I would expect it to be idling somewhere, since CPU, SSD, RAM, and network are all very low utilization.
👍 1
evoskuil17:55
Idling might imply heavy lock contention, though I can’t imagine how that is the case. It’s doesn’t deadlock and there does not appear to be an issue of thread starvation. But the performance behavior is similar to what I would expect if it was running on a single (or few) thread.
(edited)👍 1
evoskuil17:58
The network thread count is determined by config alone, which is pretty simple. One thing I do in visual studio is to pause in the debugger and look at the graphical presentation of call stacks by thread. Most threads should be in some aspect of block parse or block check. If most are idling in the threadpool this would point to the problem.
👍 1
evoskuil18:00
This looks like a list of threads. If so it seems that they are very closely synchronized.
👍 1
evoskuil18:25
I don’t see that as a productive path. There are thousands of functions and none that will cause a delay like this. If they were causing the delay they would show very high cpu because they are single thread functions.
evoskuil18:26
The most costly of them are the hash accumulation invoked from bc::network::message::block::deserialize and validation in bc::system::chain::block.check() and block.check(ctx)
👍 1