
Bitcoin full node and query server
May 2024
Archive of the libbitcoin Slack #general channel.
Wednesday, May 1, 2024

evoskuil05:29
I completed the integration of neutrino filters into the node today. Turns out the original store design was correct and still appears optimal. This is much more costly in terms of update time than the electrum addressing because it requires previous outputs be read for all blocks (including under checkpoints/milestone). This imposes an ordering similar to validation but not as strict as confirmation. So it can also be parallelized to the extent that multiple concurrent blocks exist.
I've been running the initial test concurrently with electrum address indexing. Since Electrum affects only block write it directly impacts sync time via concurrent block write. Since neutrino extends validation it is currently running sequentially and will extend validation/confirmation time but won't affect block sync much at all. It appear that sync will complete at around two hours, so an extra 15 minutes over Electrum, which is an extra 15 minutes over basic sync.
Though at that time, with all blocks and and Electrum addressing complete, the neutrino filter creation will just be passing around block 300,000. The extended time is simply from the concurrent execution using some processor and a lot of disk reading, affecting ongoing parallel writes.
evoskuil06:17
Completed in 2:10, now just computing and indexing neutrino filters and confirming in order.
I integrated the 300ms benchmark query (above) into the running node console input commands. With the node up and running (and indexing filters at about 25% disk capacity) the query executes in an average of 75ms and as low as 65 ms. That's not a typo.
evoskuil06:25
This custom ad-hoc query spans most of the store's tables, including 8 hashmap searches for each of the 3,277 payments to 3,000 addresses, all while the store is being read/written at about 25% SSD capacity...
void executor::read_test() const
{
    constexpr auto start_tx = 15'000_u32;
    constexpr auto ns_to_ms = 1'000'000_i64;
    constexpr auto target_count = 3000_size;

    // Set ensures unique addresses.
    std::set<hash_digest> keys{};
    auto tx = start_tx;

    console(format("Getting first [%1%] output address hashes.") %
        target_count);

    auto start = fine_clock::now();
    while (!cancel_ && keys.size() < target_count)
    {
        const auto outputs = query_.get_outputs(tx++);
        if (outputs->empty())
            return;

        for (const auto& put: *outputs)
        {
            keys.emplace(put->script().hash());
            if (cancel_ || keys.size() == target_count)
                break;
        }
    }
    auto end = fine_clock::now();

    console(format("Got first [%1%] unique addresses above tx [%2%] in [%3%] ms.") %
        keys.size() % start_tx % ((end - start).count() / ns_to_ms));

    struct out
    {
        // Address hash, output link, first spender link.
        hash_digest address;
        uint64_t output_fk;
        uint64_t spend_fk;
        uint64_t input_fk;

        // Output's tx link, hash, and block position.
        uint64_t tx_fk;
        hash_digest tx_hash;
        uint16_t tx_position;

        // Output tx's block link, hash, and height.
        uint32_t bk_fk;
        hash_digest bk_hash;
        uint32_t bk_height;

        // Spender's tx link, hash, and block position.
        uint64_t in_tx_fk;
        hash_digest in_tx_hash;
        uint16_t in_tx_position;

        // Spender tx's block link, hash, and height.
        uint32_t in_bk_fk;
        hash_digest in_bk_hash;
        uint32_t in_bk_height;

        // Spender (first input) and output.
        chain::output::cptr output{};
        chain::input::cptr input{};
    };

    std::vector<out> outs{};
    outs.reserve(target_count);
    using namespace database;

    start = fine_clock::now();
    for (auto& key: keys)
    {
        auto address_it = store_.address.it(key);
        if (cancel_ || address_it.self().is_terminal())
            return;

        do
        {
            table::address::record address{};
            if (cancel_ || !store_.address.get(address_it.self(), address))
                return;

            const auto out_fk = address.output_fk;
            table::output::get_parent output{};
            if (!store_.output.get(out_fk, output))
                return;

            const auto tx_fk = output.parent_fk;
            const auto block_fk = query_.to_block(tx_fk);

            // Output tx block has height.
            database::height_link bk_height{};
            table::header::get_height bk_header{};
            if (!block_fk.is_terminal())
                if (!store_.header.get(block_fk, bk_header))
                    return;
                else
                    bk_height = bk_header.height;

            // The block is confirmed by height.
            table::height::record height_record{};
            const auto confirmed = store_.confirmed.get(bk_height,
                height_record) && (height_record.header_fk == block_fk);

            // unconfirmed tx: max height/pos, null hash, terminal/zero links.
            if (!confirmed)
            {
                outs.emplace_back(
                    key,
                    out_fk,
                    max_uint64,  // spend_fk
                    max_uint64,  // input_fk

                    tx_fk,
                    null_hash,
                    max_uint16,  // position

                    block_fk,
                    null_hash,
                    max_uint32,  // height

                    // in_tx
                    max_uint64,
                    null_hash,
                    max_uint16,  // position

                    // in_bk_tx
                    max_uint32,
                    null_hash,
                    max_uint32,  // height

                    nullptr,
                    nullptr);
                continue;
            }

            // Get confirmed output tx block position.
            auto out_position = max_uint16;
            table::txs::get_position txs{ {}, tx_fk };
            if (!store_.txs.get(query_.to_txs_link(block_fk), txs))
                return;
            else
                out_position = possible_narrow_cast<uint16_t>(txs.position);

            // Get first spender only (may or may not be confirmed).
            const auto spenders = query_.to_spenders(out_fk);
            spend_link sp_fk{};
            if (!spenders.empty())
                sp_fk = spenders.front();

            // Get spender input, tx, position, block, height.
            auto in_position = max_uint16;
            input_link in_fk{};
            tx_link in_tx_fk{};
            header_link in_bk_fk{};
            height_link in_bk_height{};

            if (!sp_fk.is_terminal())
            {
                table::spend::record spend{};
                if (!store_.spend.get(sp_fk, spend))
                {
                    return;
                }
                else
                {
                    in_fk = spend.input_fk;
                    in_tx_fk = spend.parent_fk;
                }

                // Get spender tx block.
                in_bk_fk = query_.to_block(in_tx_fk);

                // Get in_tx position in the confirmed block.
                table::txs::get_position in_txs{ {}, in_tx_fk };
                if (!in_bk_fk.is_terminal())
                    if (!store_.txs.get(query_.to_txs_link(in_bk_fk), in_txs))
                        return;
                    else
                        in_position = possible_narrow_cast<uint16_t>(in_txs.position);

                // Get spender input tx block height.
                table::header::get_height in_bk_header{};
                if (!in_bk_fk.is_terminal())
                    if (!store_.header.get(in_bk_fk, in_bk_header))
                        return;
                    else
                        in_bk_height = in_bk_header.height;
            }

            const auto in = query_.get_input(sp_fk);
            const auto out = query_.get_output(out_fk);

            // confirmed tx has block height and tx position.
            outs.emplace_back(
                key,
                out_fk,
                sp_fk,
                in_fk,

                tx_fk,
                query_.get_tx_key(tx_fk),
                out_position,

                block_fk,
                query_.get_header_key(block_fk),
                bk_height,

                in_tx_fk,
                query_.get_tx_key(in_tx_fk),
                in_position,

                in_bk_fk,
                query_.get_header_key(in_bk_fk),
                in_bk_height,

                out,
                in);
        }
        while (address_it.advance());
    }
    end = fine_clock::now();

    console(format("Got all [%1%] payments to [%2%] addresses in [%3%] ms.") %
        outs.size() % keys.size() % ((end - start).count() / ns_to_ms));
}That's processing payments at an average rate of 51,203,125 per second.
evoskuil06:40
Trimming that back tot he benchmark query from sparrow (no spender info) makes it 4x faster (15-20ms), in which case we're processing 200M of those per second. Single thread, on a 7 year old machine, with no shani.
Thursday, May 2, 2024
evoskuil17:56
After working through a design for maintaining consistency given a disk full condition during a multi-table write (which only occurs with a tx write), I realized that this condition is already managed. Multi-table writes occur both concurrently and during ongoing reads, such as by validation/confirmation and also client/server queries. Full consistency is of course eventual, but all queries produce logical results even in the midst of multi-table writes. So when a single table fails to expand during a write, such as for disk full, all we need to do is stop and report it.
This is of course not the same fault tolerance problem as an uncontrolled shutdown, which we now manage by detection and recovery from snapshot. This allows for continuation from the stop point. In fact it will be possible for us to poll storage and restart writes when space becomes available. But today I'm implementing detection with pause and keyboard input to resume.
evoskuil19:30
I'm around if anyone wants to meet today. I know we talked about an earlier start - we should lock that down.
Friday, May 3, 2024
evoskuil18:38
Tracked down a store write query bug that would only surface in the disk full scenario - where the node keeps running despite
disk full errors emanating from one or more tables. Basically the queries weren't written with that expectation, but now are. Running tests now in the disk full scenario, where presently I just leave it running while it rejects storage in whatever table is full, resulting in partial writes but valid data.Also discovered a race in the node
backup implementation that can result in a deadlock. The node broadcasts a pause event so that network traffic halts, and then waits until there are no outstanding writes by waiting on a database write lock. But new channels often pop up and have not received the event, resulting in a log wait (until there is no actual write traffic). It's similar to the shutdown wait, but that's safe because it permanently terminates all channels.2 replies · evoskuil · last May 05, 2024
evoskuil15:53
Resolved this, just placed a
(edited)pause event rebroadcast in the backup event handler in the case of a wait_lock event. The wait_lock signals that store write exclusivity was not obtained for a full second and will retry. Resending the pause event suspends any channels that may have missed it on the initial send. This does technically present a halting problem, since that back and forth can theoretically go on forever, but that's extremely unlikely. If it did for some reason happen, all that occurs is the backup is deferred until store close, which suspends all channels, resulting in backup obtaining the lock, completing the snapshot, and then close obtaining the lock. So a simple one line good solution to a tricky race condition.🙌 1
Saturday, May 4, 2024
evoskuil17:53
The full chain neutrino index completed a while back, so now we have proper sizing. The total index or neutrino filters/heads with hashmap header is 10GiB. The electrum address index is 117GiB. The fully-indexed block archive is 609GiB, vs native serialization of 531GiB (15% indexation cost). The confirmation index (blocks and txs by height) is an additional 13GiB, for 622GiB so total cost of 17%. The total store with both filters is 749GiB. I'm aware of a few simple optimizations that can increase the overall efficiency maybe a couple points. But overall that's better than planned and quite excellent.
Sunday, May 5, 2024
evoskuil15:53
replied to a thread: view
Resolved this, just placed a
(edited)pause event rebroadcast in the backup event handler in the case of a wait_lock event. The wait_lock signals that store write exclusivity was not obtained for a full second and will retry. Resending the pause event suspends any channels that may have missed it on the initial send. This does technically present a halting problem, since that back and forth can theoretically go on forever, but that's extremely unlikely. If it did for some reason happen, all that occurs is the backup is deferred until store close, which suspends all channels, resulting in backup obtaining the lock, completing the snapshot, and then close obtaining the lock. So a simple one line good solution to a tricky race condition.🙌 1
evoskuil15:57
The state of the art is pretty damn sad... https://groups.google.com/g/bitcoindev/c/Ww5QMaxdDcY
😞 1
evoskuil16:22
I've completed testing against a disk full condition in which I do not attempt to suspend the network. This results in some writes succeeding and others failing with the
disk_full error state. Some will succeed because each table has an independent file with its own preallocation. Since disk_full is no longer a terminal error, the node will just continue to iterate with potential partial success and failure. Eventually if there are successes, those can fill up the preallocation and then will start failing as well. The only down side is wasted store space prior to resumption following space being freed up. Currently if I free up space the node just continues normally. But to limit wasted space we want to suspend operations as soon as a disk_full condition arises, and resume once space becomes available.Monday, May 6, 2024
evoskuil00:26
The node object doesn't have the ability to stop itself, which is intentional - sort of a design forcing function. The node (console process) stops the node via keyboard command. This forces the implementation to deal rationally with things like network disconnect, disk full, and store corruption (for example).
When reviewing the handling of store corruption and disk full I decided that it would be good to slightly modify the
libbitcoin-network stack to enable connect/accept suspension. Normally the connectors are allocated at startup and run in a callback loop, always attempting to maintain the configured number of connections. But for both backup and store full/fault conditions, we need to suspend this.
So I made those modifications, which were simple. The connector and acceptor classes are now constructed with a reference to an atomic bool, owned by p2p. This tells them to bypass connection attempts with a specific error code. Since certain errors result in a delayed retry (precluding tight loops on things like no internet or no addresses), this fits naturally into the design.evoskuil00:33
So now when there is a store fault, or a disk full, or a snapshot starting, the network stops connecting but the process remains alive. Existing connections self-terminate using a broadcast event that is picked up in the protocol base. Resume from a backup is automatic (unless there is a preexisting disk full condition). Resume from a disk full condition is currently a command line option. The store object now retains the state of each table, and provides a summary query to provide context for these operations. This is all working seamlessly at this point.
I also experimented with reducing a given preallocation so that a write may complete. But there is really no logical benefit to this, and it has a significant downside. Without preallocation, there is remap of the memory map for every single write. This is ridonkulously slow so it's not an option.
I am about to ensure that when there is a store fault the store is either recovered from a snapshot or closes with a
flush_lock file so that the corruption knowledge is retained. Disk full is not a corrupted state, so it's just a normal shutdown. However space can be freed and the command line option triggered to resume, which works perfectly.So we now have flawless disk full handling and snapshot recovery. Disk space can be increased without stopping the process, and snapshots can be backed up live. So there should currently be no reason to stop the process unless physical space is insufficient or configuration changes are required. I do have a plan to make most configuration dynamic as well.
evoskuil00:45
I am also now going to implement a
node object timer that gets set on disk full, which will poll for sufficient space to resume (this can be computed from table properties) automatically. Polling isn't probably absolutely necessary, but system events are a little more platform-specific.
Also I'm going to track accumulated store work/size (bytes, txs, validation...) so that snapshots can be taken automatically at reasonable/configurable intervals.Snapshots can of course also lead to disk full, however once there are two snapshots there is never any more size increase. All writes are first suspended, then the snapshot directories are rotated and the older one deleted. Since only headers are written, size never changes, so we can always snap once we have to written. However if the disk is full the snapshot just leaves behind the one value directory (which is why we rotate two). I've verified the snapshot disk full behavior as well.
I expect to have the above done tomorrow, and I've recently completed all of the work for Electrum addressing and Neutrino filters, and tested wince with each independently and both (as these are optional tables). That will leave me with one big chunk of work... the validation concurrency implementation. Presently it executes only one block at a time in sequence, but we can now easily validate any number of blocks concurrently, as long as all prevouts are stored. So for example, the first 10000 blocks tend to show up in a minute or two, and we can validate these all at the same time up to the top contiguous candidate height.
1 reply · evoskuil · last May 06, 2024
evoskuil00:53
This not only allows up to concurrently validate small blocks, but to validate transactions from another block as threads are freed up completing a preceding block. In other words, instead of a sine wave type of CPU utilization, it should be a true flatline from start to finish - unless of course we hit download gaps, which I have designed the downloader to be able to minimize.
The major cost with validation however is transaction read/deserialization time (in addition to previous outputs). The node is fast, but we are basically reading the entire store off the network, and then again off the disk. This is optimized for min sync time and max query speed, and performs best with full RAM capacity (like 1TB), not for min validation time. But I think it will at least be competitive there as well.
evoskuil20:37
X (formerly Twitter)
@lopp Starting to get good numbers from libbitcoin v4. I just ran the bottom line config from above (to 650,000), which completed in 62 minutes, 3x faster than above. The wire size is 281GiB and the v4 store is 343 (22% index cost). This is against the Internet over a 1Gbps wire...
🎉 1
2 replies · John Doe, evoskuil · last May 06, 2024

John Doe21:49
What do you think was the issue here? Something with his setup?
https://blog.lopp.net/2023-bitcoin-node-performance-tests/
"My libbitcoin config:
[network] peer = <local network node IP address>:8333 outbound_connections = 1 [blockchain] # I set this to the number of virtual cores since default is physical cores cores = 12 checkpoint = 000000000019d6689c085ae165831e934ff763ae46a2a6c172b3f1b60a8ce26f:0 [database] cache_capacity = 100000
"
evoskuil21:52
No idea, presumably. The v3 node isn’t even headers first and not relevant to v4 work.
👍 1
Tuesday, May 7, 2024
evoskuil11:08
As I said when setting out to do v4 a few years ago, only an order of magnitude sync speed improvement over Core would satisfy me. BN is now doing that with much more indexing in the same amount of space. https://x.com/evoskuil/status/1787795789592297725
🙌 2
evoskuil13:23
I used to be concerned about the BN mmap shutdown time, but interestingly Core's shutdown time is 2-3x longer.
evoskuil13:52
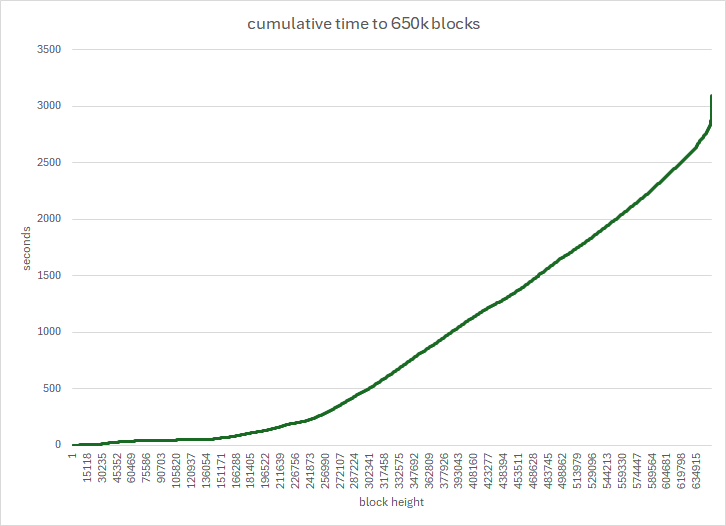
Cumulative sync time to block 650,000. Note the steep tail, which is a result of no longer being able to fan out the load. Nearly all of the work is complete in 45 minutes, and that trend continues until termination.
👀 1
evoskuil14:04
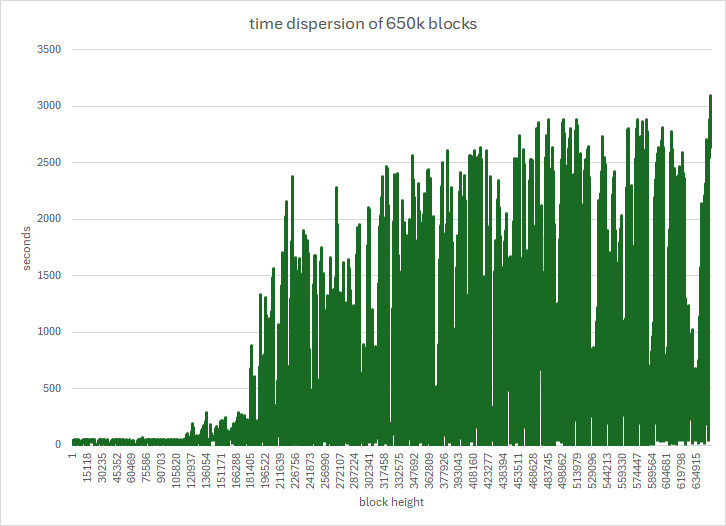
Dispersion of 650,000 blocks. Very small blocks are obtained very rapidly, despite the load being fanned out. However once blocks get full the dispersion seems pretty random/even.
evoskuil14:36
The larger gaps are a consequence of table remapping, where a table reaches its preallocated size and flushes to disk and reallocates a larger size. This can be eliminated with initial sizing, but unless there is sufficient RAM to hold the whole store, that results in thrashing, so we avoid it.
(edited)evoskuil14:42
This is the same dispersion overlaid with validation and confirmation times. Since this run is entirely under checkpoint/milestone, there is very little additional cost to these operations. Note however that confirmation requires a store write for every block and transaction, which is why it tends to track above validation.
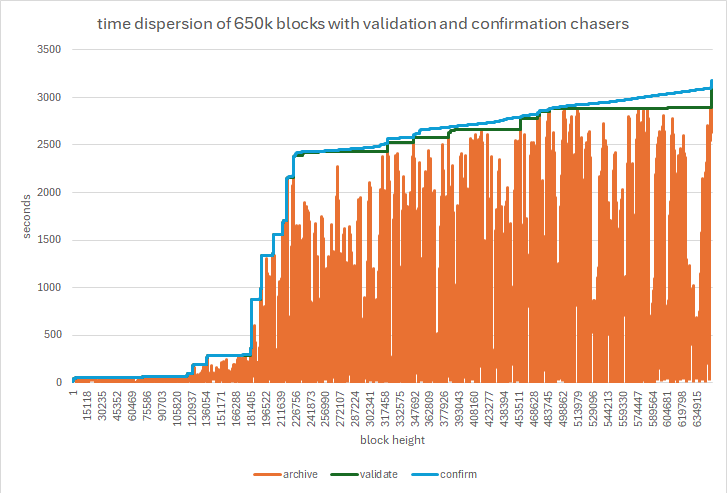
What we really want to avoid in the time dispersion, is tall spikes on the left. This delays validation/confirmation. IOW a single block 1 missing until the end would delay all validate/confirm progress until the store is fully populated.
This can be mitigated with a moving completion window. However that has the downside of restricting bandwidth utilization as gaps are waited on. That makes sense when validating, but as you can see above, probably not when under checkpoint/milestone.
I've already implemented the moving window, but will wait until validation fan-out is implemented to tune it.
evoskuil15:35
Last night I discovered that
(edited)node (not network) is leaking closed channels. It's also possible for channels to miss chaser events given how they asynchronously subscribe. So I'll be cleaning that up (requires a desubscriber object vs. a simple subscriber).The leak isn't actually a process memory leak, as the objects are held until close and then released. But closed channels are held until process close, which means they accumulate and will eventually drag down performance.
Wednesday, May 8, 2024
evoskuil04:46
After resolving the channel leak, I compiled a build with the most of the logging compiled out (one of our build options). I can the same 650k block sync described above, but with the very large Electrum address indexing. The run completed faster than above - fully downloaded and confirmed in 55 minutes. And with an extra 66 GiB index of all addresses in the blockchain up to that height. The only difference in the configuration was 16 vs. 15 network threads. This small additional amount of horsepower allows the network bandwidth to remain redlined for the entire run. That Electrum index typically takes days to weeks to build directly off of a fully-synced Core node, and we are getting it for free - with orders of magnitude faster query.
evoskuil11:52
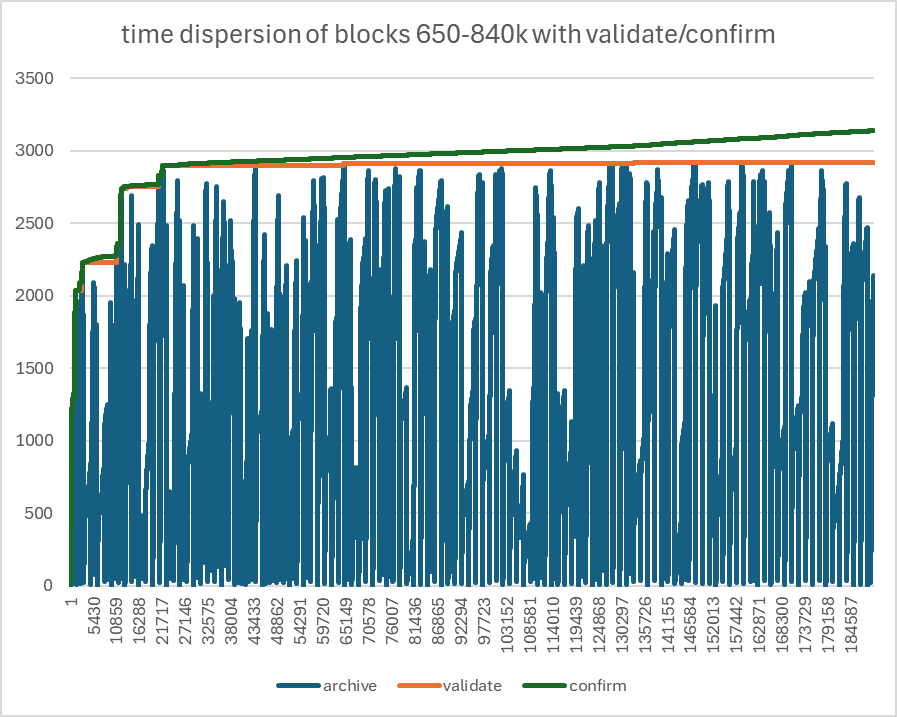
Extending the Electrum Server run above to 840,000 took 52 minutes (1:47 total) and increased the address index to 115GiB (2,784,257,776 unique payment addresses indexed).
Thursday, May 9, 2024
evoskuil05:01
Spent the day mostly on technical debt, cleaning up the
bn command line and settings as well as the add-hoc executable source. Added a few things while I was at it, including an option to detect platform intrinsics:
Intrinsics...
arm..... present:0.
intel... present:1.
avx512.. present:0 compiled:1.
avx2.... present:1 compiled:1.
sse41... present:1 compiled:1.
shani... present:0 compiled:1.
neon.... present:0 compiled:0.
As well as auto-restore on process startup with store corruption (from uncontrolled process termination) :
2024-05-09T05:03:27Z.0 ====================== startup =======================
2024-05-09T05:03:27Z.0 Press CTRL-C to stop the node.
2024-05-09T05:03:27Z.0 Log system configuration...
2024-05-09T05:03:27Z.0 Application.. compiled:1 enabled:1.
2024-05-09T05:03:27Z.0 News......... compiled:1 enabled:1.
2024-05-09T05:03:27Z.0 Session...... compiled:1 enabled:1.
2024-05-09T05:03:27Z.0 Protocol..... compiled:1 enabled:0.
2024-05-09T05:03:27Z.0 ProXy........ compiled:1 enabled:0.
2024-05-09T05:03:27Z.0 Wire......... compiled:0 enabled:0.
2024-05-09T05:03:27Z.0 Remote....... compiled:1 enabled:1.
2024-05-09T05:03:27Z.0 Fault........ compiled:1 enabled:1.
2024-05-09T05:03:27Z.0 Quit......... compiled:1 enabled:0.
2024-05-09T05:03:27Z.0 Object....... compiled:0 enabled:0.
2024-05-09T05:03:27Z.0 Verbose...... compiled:1 enabled:0.
2024-05-09T05:03:27Z.0 Using config file: "f:\\bn.cfg"
2024-05-09T05:03:27Z.0 Database failed to start with error 'flush lock failure'.
2024-05-09T05:03:27Z.0 Please wait while restoring from most recent snapshot...
2024-05-09T05:03:27Z.0 restore::recover_snapshot(store)
2024-05-09T05:03:45Z.0 restore::open_file(header_head)
2024-05-09T05:03:45Z.0 restore::open_file(header_body)
2024-05-09T05:03:45Z.0 restore::open_file(input_head)
2024-05-09T05:03:45Z.0 restore::open_file(input_body)
2024-05-09T05:03:45Z.0 restore::open_file(output_head)
2024-05-09T05:03:45Z.0 restore::open_file(output_body)
2024-05-09T05:03:45Z.0 restore::open_file(point_head)
2024-05-09T05:03:45Z.0 restore::open_file(point_body)
2024-05-09T05:03:45Z.0 restore::open_file(puts_head)
2024-05-09T05:03:45Z.0 restore::open_file(puts_body)
2024-05-09T05:03:45Z.0 restore::open_file(spend_head)
2024-05-09T05:03:45Z.0 restore::open_file(spend_body)
2024-05-09T05:03:45Z.0 restore::open_file(tx_head)
2024-05-09T05:03:45Z.0 restore::open_file(tx_body)
2024-05-09T05:03:45Z.0 restore::open_file(txs_head)
2024-05-09T05:03:45Z.0 restore::open_file(txs_body)
2024-05-09T05:03:45Z.0 restore::open_file(candidate_head)
2024-05-09T05:03:45Z.0 restore::open_file(candidate_body)
2024-05-09T05:03:45Z.0 restore::open_file(confirmed_head)
2024-05-09T05:03:45Z.0 restore::open_file(confirmed_body)
2024-05-09T05:03:45Z.0 restore::open_file(strong_tx_head)
2024-05-09T05:03:45Z.0 restore::open_file(strong_tx_body)
2024-05-09T05:03:45Z.0 restore::open_file(validated_bk_head)
2024-05-09T05:03:45Z.0 restore::open_file(validated_bk_body)
2024-05-09T05:03:45Z.0 restore::open_file(validated_tx_head)
2024-05-09T05:03:45Z.0 restore::open_file(validated_tx_body)
2024-05-09T05:03:45Z.0 restore::open_file(address_head)
2024-05-09T05:03:45Z.0 restore::open_file(address_body)
2024-05-09T05:03:45Z.0 restore::open_file(neutrino_head)
2024-05-09T05:03:45Z.0 restore::open_file(neutrino_body)
2024-05-09T05:03:45Z.0 restore::load_file(header_head)
2024-05-09T05:03:45Z.0 restore::load_file(header_body)
2024-05-09T05:03:45Z.0 restore::load_file(input_head)
2024-05-09T05:03:45Z.0 restore::load_file(input_body)
2024-05-09T05:03:45Z.0 restore::load_file(output_head)
2024-05-09T05:03:45Z.0 restore::load_file(output_body)
2024-05-09T05:03:45Z.0 restore::load_file(point_head)
2024-05-09T05:03:45Z.0 restore::load_file(point_body)
2024-05-09T05:03:45Z.0 restore::load_file(puts_head)
2024-05-09T05:03:45Z.0 restore::load_file(puts_body)
2024-05-09T05:03:45Z.0 restore::load_file(spend_head)
2024-05-09T05:03:45Z.0 restore::load_file(spend_body)
2024-05-09T05:03:45Z.0 restore::load_file(tx_head)
2024-05-09T05:03:45Z.0 restore::load_file(tx_body)
2024-05-09T05:03:45Z.0 restore::load_file(txs_head)
2024-05-09T05:03:45Z.0 restore::load_file(txs_body)
2024-05-09T05:03:45Z.0 restore::load_file(candidate_head)
2024-05-09T05:03:45Z.0 restore::load_file(candidate_body)
2024-05-09T05:03:45Z.0 restore::load_file(confirmed_head)
2024-05-09T05:03:45Z.0 restore::load_file(confirmed_body)
2024-05-09T05:03:45Z.0 restore::load_file(strong_tx_head)
2024-05-09T05:03:45Z.0 restore::load_file(strong_tx_body)
2024-05-09T05:03:45Z.0 restore::load_file(validated_bk_head)
2024-05-09T05:03:45Z.0 restore::load_file(validated_bk_body)
2024-05-09T05:03:45Z.0 restore::load_file(validated_tx_head)
2024-05-09T05:03:45Z.0 restore::load_file(validated_tx_body)
2024-05-09T05:03:45Z.0 restore::load_file(address_head)
2024-05-09T05:03:45Z.0 restore::load_file(address_body)
2024-05-09T05:03:45Z.0 restore::load_file(neutrino_head)
2024-05-09T05:03:45Z.0 restore::load_file(neutrino_body)
2024-05-09T05:03:45Z.0 restore::restore_table(header_table)
2024-05-09T05:03:45Z.0 restore::restore_table(input_table)
2024-05-09T05:03:45Z.0 restore::restore_table(output_table)
2024-05-09T05:03:45Z.0 restore::restore_table(point_table)
2024-05-09T05:03:45Z.0 restore::restore_table(puts_table)
2024-05-09T05:03:45Z.0 restore::restore_table(spend_table)
2024-05-09T05:03:45Z.0 restore::restore_table(tx_table)
2024-05-09T05:03:45Z.0 restore::restore_table(txs_table)
2024-05-09T05:03:45Z.0 restore::restore_table(candidate_table)
2024-05-09T05:03:45Z.0 restore::restore_table(confirmed_table)
2024-05-09T05:03:45Z.0 restore::restore_table(strong_tx_table)
2024-05-09T05:03:45Z.0 restore::restore_table(validated_bk_table)
2024-05-09T05:03:45Z.0 restore::restore_table(validated_tx_table)
2024-05-09T05:03:45Z.0 restore::restore_table(address_table)
2024-05-09T05:03:45Z.0 restore::restore_table(neutrino_table)
2024-05-09T05:03:45Z.0 Restored the database in 17 secs.
As well as handling when there are no snapshots:
2024-05-09T05:05:53Z.0 ====================== startup =======================
2024-05-09T05:05:53Z.0 Press CTRL-C to stop the node.
2024-05-09T05:05:53Z.0 Log system configuration...
2024-05-09T05:05:53Z.0 Application.. compiled:1 enabled:1.
2024-05-09T05:05:53Z.0 News......... compiled:1 enabled:1.
2024-05-09T05:05:53Z.0 Session...... compiled:1 enabled:1.
2024-05-09T05:05:53Z.0 Protocol..... compiled:1 enabled:0.
2024-05-09T05:05:53Z.0 ProXy........ compiled:1 enabled:0.
2024-05-09T05:05:53Z.0 Wire......... compiled:0 enabled:0.
2024-05-09T05:05:53Z.0 Remote....... compiled:1 enabled:1.
2024-05-09T05:05:53Z.0 Fault........ compiled:1 enabled:1.
2024-05-09T05:05:53Z.0 Quit......... compiled:1 enabled:0.
2024-05-09T05:05:53Z.0 Object....... compiled:0 enabled:0.
2024-05-09T05:05:53Z.0 Verbose...... compiled:1 enabled:0.
2024-05-09T05:05:53Z.0 Using config file: "f:\\bn.cfg"
2024-05-09T05:05:53Z.0 Database failed to start with error 'flush lock failure'.
2024-05-09T05:05:53Z.0 Please wait while restoring from most recent snapshot...
2024-05-09T05:05:53Z.0 restore::recover_snapshot(store)
2024-05-09T05:05:53Z.0 Database restore failed with error 'missing snapshot'.
2024-05-09T05:05:53Z.0 Node stopped successfully.
2024-05-09T05:05:53Z.0 ====================== shutdown ======================
2024-05-09T05:05:53Z.0 Press <enter> to exit...
Also as you can see above, log system config. This is helpful since the log system allows for all or some categories to be compiled out, such that the messages are not even constructed. But this can be misleading if it's not clear in the log or at the console what options are both compiled and enabled. They can be toggled on the command line, if compiled in, which reflects in the log. But this allows us to see log levels from startup.
Also added the ability to snapshot the store from the command line, vs. only when the process is running. eg:
$ bn -c f:\bn.cfg -b
Using config file: "f:\bn.cfg"
Database is started.
Backup is started.
backup::flush_body(header_body)
backup::flush_body(input_body)
backup::flush_body(output_body)
backup::flush_body(point_body)
...
(edited)
There are a bunch of great command line and runtime options now that are really helpful when working with the store.
$ bn -c f:\bn.cfg -f
Using config file: "f:\bn.cfg"
Database is started.
Press CTRL-C to cancel operation.
Forked from [00000000000000000000000000000000] to [00000000000000100000000010001011] at [00000000839a8e6886ab5951d76f411475428afc90947ee320161bbf18eb6048:1]
Forked from [00000000000000100000000010001011] to [00000000000000100000000010000011] at [00000000000a4d0a398161ffc163c503763b1f4360639393e0e4c8e300e0caec:91842]
Forked from [00000000000000100000000010000011] to [00000000000000100000000010001011] at [0000000000016ca756e810d44aee6be7eabad75d2209d7f4542d1fd53bafc984:91843]
Forked from [00000000000000100000000010001011] to [00000000000000100000000010000011] at [00000000000743f190a18c5577a3c2d2a1f610ae9601ac046a38084ccb7cd721:91880]
Forked from [00000000000000100000000010000011] to [00000000000000100000000010001011] at [00000000000cf6204ce82deed75b050014dc57d7bb462d7214fcc4e59c48d66d:91881]
Forked from [00000000000000100000000010001011] to [00000000000000100000000010001111] at [00000000000000ce80a7e057163a4db1d5ad7b20fb6f598c9597b9665c8fb0d4:173805]
Forked from [00000000000000100000000010001111] to [00000000000000100000000010011111] at [000000000000024b89b42a942fe0d9fea3bb44ab7bd1b19115dd6a759c0808b8:227931]
Forked from [00000000000000100000000010011111] to [00000000000000100000000010010111] at [0000000000000000242af5e3a276d9c1546dffa6ba59de791c7e89afe929f22c:295001]
Forked from [00000000000000100000000010010111] to [00000000000000100000000010110111] at [00000000000000000379eaa19dce8c9b722d46ae6a57c2f1a988119488b50931:363725]
Forked from [00000000000000100000000010110111] to [00000000000000100000000011110111] at [000000000000000004c2b624ed5d7756c508d90fd0da2c7c679febfa6c4735f0:388381]
Forked from [00000000000000100000000011110111] to [00000000000000100000011111110111] at [000000000000000004a1b34462cb8aeebd5799177f7a29cf28f2d1961716b5b5:419328]
Forked from [00000000000000100000011111110111] to [00000000000000100011111111110111] at [0000000000000000001c8018d9cb3b742ef25114f27563e3fc4a1902167f9893:481824]
Scanned 842658 headers for rule forks in 731 ms.
(edited)
The help is autogenerated from source, using the same libs as bx and server.
$ bn -c f:\bn.cfg -h

Usage: bn [-abdfhiklmrsvwx] [--config value]

Info: Runs a full bitcoin node.

Options (named):

-a [--slabs]         Scan and display store slab measures.
-b [--backup]        Backup to a snapshot (can also do live).
-c [--config]        Specify path to a configuration settings file.
-d [--hardware]      Display hardware compatibility.
-f [--flags]         Scan and display all flag transitions.
-h [--help]          Display command line options.
-i [--initchain]     Initialize store in configured directory.
-k [--buckets]       Scan and display all bucket densities.
-l [--collisions]    Scan and display hashmap collision stats.
-m [--measure]       Scan and display store measures.
-r [--read]          Read test and display performance.
-s [--settings]      Display all configuration settings.
-v [--version]       Display version information.
-w [--write]         Write test and display performance.
-x [--restore]       Restore from most recent snapshot.
The abiltiy to scan the entire store to get slab counts, actual bucket collisions, flag inflections, and general store stats is big helpful when it comes to table sizing and perf metrics.
$ bn -c f:\bn.cfg -m
Using config file: "f:\\bn.cfg"
Database is started.
Body sizes...
   header    :81737923
   txs       :782483017
   tx        :12038595862
   point     :9237925692
   input     :68112813752
   output    :18806129371
   puts      :4695083260
   candidate :2527977
   confirmed :606444
   spend     :11951874960
   strong_tx :92825832
   valid_tx  :23
   valid_bk  :8
   address   :22706074440
   neutrino  :0
Table records...
   header    :842659
   tx        :194170901
   point     :256609047
   candidate :842659
   confirmed :202148
   spend     :497994790
   strong_tx :7735486
   address   :540620820
Head buckets...
   header    :524493
   txs       :524493
   tx        :551320125
   point     :546188501
   spend     :1459791875
   strong_tx :551320125
   valid_tx  :551320125
   valid_bk  :524493
   address   :1459791875
   neutrino  :1
Collision rates...
   header    :1.60662
   txs       :1.60662
   tx        :0.352193
   point     :0.469818
   spend     :0.341141
   strong_tx :0.0140308
   valid_tx  :0.352193
   valid_bk  :1.60662
   address   :0.370341
   neutrino  :0
Thinking...
Chain progress...
   fork pt   :202147
   top conf  :202147:00000000000001ba80ec8a53d799eabfd6697d4df4eb8bff22b0c997c0240373
   top cand  :842658:000000000000000000022644b4cc8c65ab3564c1e01de433e50d9582beb033f8
   top assoc :202148
   associated:386626
   wire conf :3343025952
   wire cand :108292014268
Please wait while database is stopping...
Database stopped successfully in 11 secs.
Tomorrow I'm going to add in the auto-backup so that our auto-recovery is just automagic. It's trivial to do as it already operates from a runtime option. Just need to set up a trigger for it. Also will set up a disk space monitor to automatically recover from a disk full condition (also presently enabled presently via a runtime option).
(edited)I've also incorporated a cmdline option for a built-in performance test. This will make it easier for use to get reliable query performance benchmarks.
evoskuil05:29
I continue to experience consistent sync performance, at 1h:30m to block 840,000 including all 115GiB of Electrum Server indexing. Also still am never experiencing unexplained behavior. The node and code it depends upon have been superbly reliable.
evoskuil05:36
Also removed the last node build dependencies on
libbitcoin-consensus today, since Core has removed their support for it. They never gave it a serious effort and as a result it wasn't really worth us maintaining.Forgot to mention a couple of the other useful new command line options, this one
w allows us to dump the download work distribution across peers. The number is the count of block hashes held by the channel. These get subtracted out as the requested blocks arrive. Work load balancing is an important part of maintaining performance. When the node is close to complete, this is a list of all (1) and then all (0) - which is cool to see, as that balancing isn't easy.
2024-05-09T05:36:19Z.1 Work (401) for channel [3.81.214.163:8333].
2024-05-09T05:36:19Z.1 Work (275) for channel [3.130.132.234:8333].
2024-05-09T05:36:19Z.1 Work (814) for channel [167.99.125.50:8333].
2024-05-09T05:36:19Z.1 Work (1135) for channel [108.49.232.210:8333].
2024-05-09T05:36:19Z.1 Work (919) for channel [54.84.231.203:8333].
2024-05-09T05:36:19Z.1 Work (1191) for channel [3.19.154.196:8333].
2024-05-09T05:36:19Z.1 Work (914) for channel [34.204.100.116:8333].
2024-05-09T05:36:19Z.1 Work (1042) for channel [51.222.249.153:8339].
2024-05-09T05:36:19Z.1 Work (936) for channel [154.38.185.146:8333].
2024-05-09T05:36:19Z.1 Work (2948) for channel [71.127.40.169:8333].
2024-05-09T05:36:19Z.1 Work (847) for channel [66.94.103.62:8333].
2024-05-09T05:36:19Z.1 Work (958) for channel [154.38.185.204:8333].
2024-05-09T05:36:19Z.1 Work (998) for channel [99.99.12.59:8333].
2024-05-09T05:36:19Z.1 Work (1325) for channel [51.81.67.34:8333].
2024-05-09T05:36:19Z.1 Work (1404) for channel [203.161.33.132:8333].
2024-05-09T05:36:19Z.1 Work (999) for channel [119.224.78.28:8333].
2024-05-09T05:36:19Z.1 Work (838) for channel [18.224.59.88:8333].
2024-05-09T05:36:19Z.1 Work (310) for channel [3.143.225.236:8333].
2024-05-09T05:36:19Z.1 Work (990) for channel [66.94.117.48:8333].
2024-05-09T05:36:19Z.1 Work (2873) for channel [89.117.74.213:8333].
2024-05-09T05:36:19Z.1 Work (3121) for channel [100.36.127.250:8333].
2024-05-09T05:36:19Z.1 Work (1434) for channel [99.8.76.101:8333].
2024-05-09T05:36:19Z.1 Work (3005) for channel [138.197.173.43:8333].
2024-05-09T05:36:19Z.1 Work (1013) for channel [89.117.76.95:8333].
2024-05-09T05:36:19Z.1 Work (1577) for channel [169.197.147.164:51172].
2024-05-09T05:36:19Z.1 Work (1588) for channel [88.198.10.155:30865].
2024-05-09T05:36:19Z.1 Work (1356) for channel [166.78.241.9:8333].
2024-05-09T05:36:19Z.1 Work (1345) for channel [18.188.94.72:8333].
2024-05-09T05:36:19Z.1 Work (1433) for channel [149.28.219.168:48871].
2024-05-09T05:36:19Z.1 Work (1057) for channel [147.135.70.192:8333].
2024-05-09T05:36:19Z.1 Work (2625) for channel [192.99.101.86:8333].
2024-05-09T05:36:19Z.1 Work (1431) for channel [134.122.46.153:8333].
2024-05-09T05:36:19Z.1 Work (1404) for channel [69.131.98.87:8333].
2024-05-09T05:36:19Z.1 Work (1259) for channel [18.27.79.17:8333].
2024-05-09T05:36:19Z.1 Work (1298) for channel [64.225.29.221:8333].
2024-05-09T05:36:19Z.1 Work (3092) for channel [34.201.35.203:8333].
2024-05-09T05:36:19Z.1 Work (1472) for channel [141.98.219.12:8333].
2024-05-09T05:36:19Z.1 Work (1383) for channel [89.117.78.19:8333].
2024-05-09T05:36:19Z.1 Work (1471) for channel [212.227.234.138:8333].
2024-05-09T05:36:19Z.1 Work (3066) for channel [31.220.98.248:8333].
2024-05-09T05:36:19Z.1 Work (3030) for channel [31.220.96.182:8333].
2024-05-09T05:36:19Z.1 Work (1513) for channel [154.38.185.98:8333].
2024-05-09T05:36:19Z.1 Work (1362) for channel [154.38.186.125:8333].
2024-05-09T05:36:19Z.1 Work (3149) for channel [204.16.244.120:8333].
2024-05-09T05:36:19Z.1 Work (1338) for channel [104.57.241.130:8333].
2024-05-09T05:36:19Z.1 Work (3182) for channel [31.220.78.114:8333].
2024-05-09T05:36:19Z.1 Work (1541) for channel [209.126.12.178:8333].
2024-05-09T05:36:19Z.1 Work (1478) for channel [154.12.237.82:8333].
2024-05-09T05:36:19Z.1 Work (1447) for channel [8.209.70.77:8333].
2024-05-09T05:36:19Z.1 Work (1439) for channel [158.220.116.145:8333].
2024-05-09T05:36:19Z.1 Work (509) for channel [131.153.168.226:8333].
2024-05-09T05:36:19Z.1 Work (1398) for channel [207.244.244.12:8333].
2024-05-09T05:36:19Z.1 Work (1422) for channel [185.111.156.55:8333].
2024-05-09T05:36:19Z.1 Work (1395) for channel [174.91.192.47:8333].
2024-05-09T05:36:19Z.1 Work (977) for channel [37.60.235.23:8333].
2024-05-09T05:36:19Z.1 Work (1462) for channel [64.23.238.176:8333].
2024-05-09T05:36:19Z.1 Work (1405) for channel [108.225.35.253:8333].
2024-05-09T05:36:19Z.1 Work (1275) for channel [86.155.192.194:8333].
2024-05-09T05:36:19Z.1 Work (1458) for channel [84.247.172.213:8333].
2024-05-09T05:36:19Z.1 Work (1523) for channel [174.109.172.57:8333].
2024-05-09T05:36:19Z.1 Work (834) for channel [73.68.70.94:8333].
2024-05-09T05:36:19Z.1 Work (1512) for channel [38.242.222.117:8333].
2024-05-09T05:36:19Z.1 Work (1424) for channel [35.199.190.33:8333].
2024-05-09T05:36:19Z.1 Work (3136) for channel [74.96.167.182:8333].
2024-05-09T05:36:19Z.1 Work (1504) for channel [154.12.237.188:8333].
2024-05-09T05:36:19Z.1 Work (1140) for channel [62.169.29.253:8333].
2024-05-09T05:36:19Z.1 Work (1490) for channel [37.120.191.196:8333].
2024-05-09T05:36:19Z.1 Work (1540) for channel [62.169.19.165:8333].
2024-05-09T05:36:19Z.1 Work (1365) for channel [96.232.127.245:8333].
2024-05-09T05:36:19Z.1 Work (1384) for channel [5.2.79.49:8333].
2024-05-09T05:36:19Z.1 Work (2082) for channel [50.99.219.56:8333].
2024-05-09T05:36:19Z.1 Work (2548) for channel [148.113.159.109:8333].
2024-05-09T05:36:19Z.1 Work (1421) for channel [37.60.224.4:8333].
2024-05-09T05:36:19Z.1 Work (1285) for channel [35.92.50.35:8333].
2024-05-09T05:36:19Z.1 Work (1313) for channel [37.60.227.181:8333].
2024-05-09T05:36:19Z.1 Work (1357) for channel [91.66.77.135:8333].
2024-05-09T05:36:19Z.1 Work (1492) for channel [64.20.45.42:8333].
2024-05-09T05:36:19Z.1 Work (1438) for channel [82.65.34.49:8333].
2024-05-09T05:36:19Z.1 Work (1591) for channel [37.187.122.25:8333].
2024-05-09T05:36:19Z.1 Work (1373) for channel [169.197.82.211:8333].
2024-05-09T05:36:19Z.1 Work (1566) for channel [173.171.2.241:8333].
2024-05-09T05:36:19Z.1 Work (1521) for channel [154.202.2.224:8333].
2024-05-09T05:36:19Z.1 Work (1445) for channel [75.172.7.116:8333].
2024-05-09T05:36:19Z.1 Work (1420) for channel [50.67.16.54:8333].
2024-05-09T05:36:19Z.1 Work (1359) for channel [75.119.153.252:8333].
2024-05-09T05:36:19Z.1 Work (1102) for channel [85.1.106.229:8333].
2024-05-09T05:36:19Z.1 Work (1466) for channel [69.176.188.251:8333].
2024-05-09T05:36:19Z.1 Work (1249) for channel [31.220.76.171:8333].
2024-05-09T05:36:19Z.1 Work (1338) for channel [69.165.205.142:8833].
2024-05-09T05:36:19Z.1 Work (1519) for channel [68.191.43.118:8333].
2024-05-09T05:36:19Z.1 Work (2278) for channel [84.247.187.27:8333].
2024-05-09T05:36:19Z.1 Work (1416) for channel [35.194.39.250:8333].
2024-05-09T05:36:19Z.1 Work (1387) for channel [34.31.229.3:8333].
2024-05-09T05:36:19Z.1 Work (1248) for channel [91.123.183.219:8333].
2024-05-09T05:36:19Z.1 Work (1413) for channel [213.165.72.125:8333].
2024-05-09T05:36:19Z.1 Work (1505) for channel [47.144.22.230:8333].
2024-05-09T05:36:19Z.1 Work (2977) for channel [34.123.213.165:8333].
2024-05-09T05:36:19Z.1 Work (2555) for channel [65.108.122.251:8333].
2024-05-09T05:36:19Z.1 Work (1069) for channel [89.58.10.65:8333].
2024-05-09T05:36:19Z.1 Work (1393) for channel [74.96.169.16:8333].
2024-05-09T05:36:19Z.1 Work (1265) for channel [84.112.189.182:8333].
2024-05-09T05:36:19Z.1 Work (2828) for channel [62.169.20.134:8333].
2024-05-09T05:36:19Z.1 Work (1543) for channel [70.77.91.155:8333].
2024-05-09T05:36:19Z.1 Work (1408) for channel [204.194.220.39:8333].
2024-05-09T05:36:19Z.1 Work (750) for channel [34.18.69.244:8333].
2024-05-09T05:36:19Z.1 Work (1427) for channel [37.60.224.208:8333].
2024-05-09T05:36:19Z.1 Work (1299) for channel [178.38.6.52:8333].
2024-05-09T05:36:19Z.1 Work (1500) for channel [76.156.91.221:8333].
2024-05-09T05:36:19Z.1 Work (1390) for channel [82.181.221.241:8333].
2024-05-09T05:36:19Z.1 Work (1346) for channel [68.197.203.181:8333].
2024-05-09T05:36:19Z.1 Work (1382) for channel [141.94.100.216:8333].
2024-05-09T05:36:19Z.1 Work (3123) for channel [73.250.52.95:8333].
2024-05-09T05:36:19Z.1 Work (1509) for channel [194.163.162.249:8333].
2024-05-09T05:36:19Z.1 Work (1420) for channel [87.236.146.176:8333].
2024-05-09T05:36:19Z.1 Work (1450) for channel [47.234.214.220:8333].
2024-05-09T05:36:19Z.1 Work (3073) for channel [98.233.86.37:8333].
2024-05-09T05:36:19Z.1 Work (1292) for channel [34.106.139.46:8333].
2024-05-09T05:36:19Z.1 Work (292) for channel [136.243.89.18:8333].
2024-05-09T05:36:19Z.1 Work (1438) for channel [216.186.236.98:8333].
2024-05-09T05:36:19Z.1 Work (1384) for channel [37.60.240.121:8333].
2024-05-09T05:36:19Z.1 Work (1495) for channel [37.60.237.59:8333].
2024-05-09T05:36:19Z.1 Work (1509) for channel [158.220.85.6:8333].
2024-05-09T05:36:19Z.1 Work (781) for channel [108.180.186.165:8333].
2024-05-09T05:36:19Z.1 Work (1541) for channel [73.19.158.188:8333].
2024-05-09T05:36:19Z.1 Work (1518) for channel [84.247.188.28:8333].
2024-05-09T05:36:19Z.1 Work (1573) for channel [47.201.168.50:8333].
2024-05-09T05:36:19Z.1 Work (1239) for channel [194.163.142.136:8333].
2024-05-09T05:36:19Z.1 Work (1221) for channel [162.231.245.176:8333].
2024-05-09T05:36:19Z.1 Work (1431) for channel [154.12.225.43:8333].
2024-05-09T05:36:19Z.1 Work (1425) for channel [104.192.226.106:8333].
2024-05-09T05:36:19Z.1 Work (1369) for channel [90.11.209.115:8333].
2024-05-09T05:36:19Z.1 Work (2991) for channel [35.180.33.119:8333].
2024-05-09T05:36:19Z.1 Work (3079) for channel [185.69.53.153:8333].
2024-05-09T05:36:19Z.1 Work (1481) for channel [37.60.232.75:8333].
2024-05-09T05:36:19Z.1 Work (1275) for channel [84.247.179.36:8333].
2024-05-09T05:36:19Z.1 Work (1463) for channel [66.35.84.30:8333].
2024-05-09T05:36:19Z.1 Work (1453) for channel [149.102.130.84:8333].
2024-05-09T05:36:19Z.1 Work (1482) for channel [62.178.135.222:8333].
2024-05-09T05:36:19Z.1 Work (1551) for channel [71.224.113.86:8333].
2024-05-09T05:36:19Z.1 Work (3041) for channel [37.60.231.198:8333].
2024-05-09T05:36:19Z.1 Work (1497) for channel [142.112.147.96:8333].
2024-05-09T05:36:19Z.1 Work (1473) for channel [37.60.231.199:8333].
2024-05-09T05:36:19Z.1 Work (1496) for channel [3.134.106.29:8333].
2024-05-09T05:36:19Z.1 Work (2905) for channel [37.60.227.179:8333].
2024-05-09T05:36:19Z.1 Work (1465) for channel [158.220.89.7:8333].
2024-05-09T05:36:19Z.1 Work (1459) for channel [104.196.231.248:8333].
2024-05-09T05:36:19Z.1 Work (1489) for channel [156.47.69.226:8333].
2024-05-09T05:36:19Z.1 Work (1424) for channel [123.60.213.192:8333].
2024-05-09T05:36:19Z.1 Work (1121) for channel [51.75.144.69:8333].
2024-05-09T05:36:19Z.1 Work (1437) for channel [209.145.52.23:8333].
2024-05-09T05:36:19Z.1 Work (1529) for channel [62.133.28.74:8333].
2024-05-09T05:36:19Z.1 Work (1388) for channel [66.94.112.105:8333].
2024-05-09T05:36:19Z.1 Work (1283) for channel [143.110.171.5:8333].
2024-05-09T05:36:19Z.1 Work (864) for channel [146.90.179.212:8333].
2024-05-09T05:36:19Z.1 Work (1454) for channel [192.184.254.35:8333].
2024-05-09T05:36:19Z.1 Work (1477) for channel [130.185.119.91:8333].
2024-05-09T05:36:19Z.1 Work (1490) for channel [35.82.222.134:8333].
2024-05-09T05:36:19Z.1 Work (558) for channel [34.94.255.160:8333].
2024-05-09T05:36:19Z.1 Work (1584) for channel [31.220.88.12:8333].
2024-05-09T05:36:19Z.1 Work (1415) for channel [82.66.105.60:8333].
2024-05-09T05:36:19Z.1 Work (1525) for channel [34.94.246.180:8333].
2024-05-09T05:36:19Z.1 Work (1507) for channel [95.144.4.168:8333].
2024-05-09T05:36:19Z.1 Work (1448) for channel [77.237.233.94:8333].
2024-05-09T05:36:19Z.1 Work (1375) for channel [51.9.205.49:8333].
2024-05-09T05:36:19Z.1 Work (1349) for channel [78.46.78.181:8333].
2024-05-09T05:36:19Z.1 Work (1529) for channel [207.244.239.215:8333].
...
(edited)
We can also runtime dump the condition of each store table, for example (notice that
input_body is showing disk_full , while the others still have capacity from their preallocations. Once space is freed the network will start right back up again, otherwise it just sits idle but able to answer queries.
2024-05-09T05:41:14Z.0 condition::header_body(success)
2024-05-09T05:41:14Z.0 condition::input_body(disk full)
2024-05-09T05:41:14Z.0 condition::output_body(success)
2024-05-09T05:41:14Z.0 condition::point_body(success)
2024-05-09T05:41:14Z.0 condition::puts_body(success)
2024-05-09T05:41:14Z.0 condition::spend_body(success)
2024-05-09T05:41:14Z.0 condition::tx_body(success)
2024-05-09T05:41:14Z.0 condition::txs_body(success)
2024-05-09T05:41:14Z.0 condition::candidate_body(success)
2024-05-09T05:41:14Z.0 condition::confirmed_body(success)
2024-05-09T05:41:14Z.0 condition::strong_tx_body(success)
2024-05-09T05:41:14Z.0 condition::validated_bk_body(success)
2024-05-09T05:41:14Z.0 condition::validated_tx_body(success)
2024-05-09T05:41:14Z.0 condition::address_body(success)
2024-05-09T05:41:14Z.0 condition::neutrino_body(success)
evoskuil15:20
Here's a good example of the overall cost of late-arriving blocks. The last block was 659,001, which cost 28 minutes of confirmation wait time. Total time to 840k with Electrum index was 2:13, normally closed to 1:45. Shutdown time was just 202 secs.
(edited)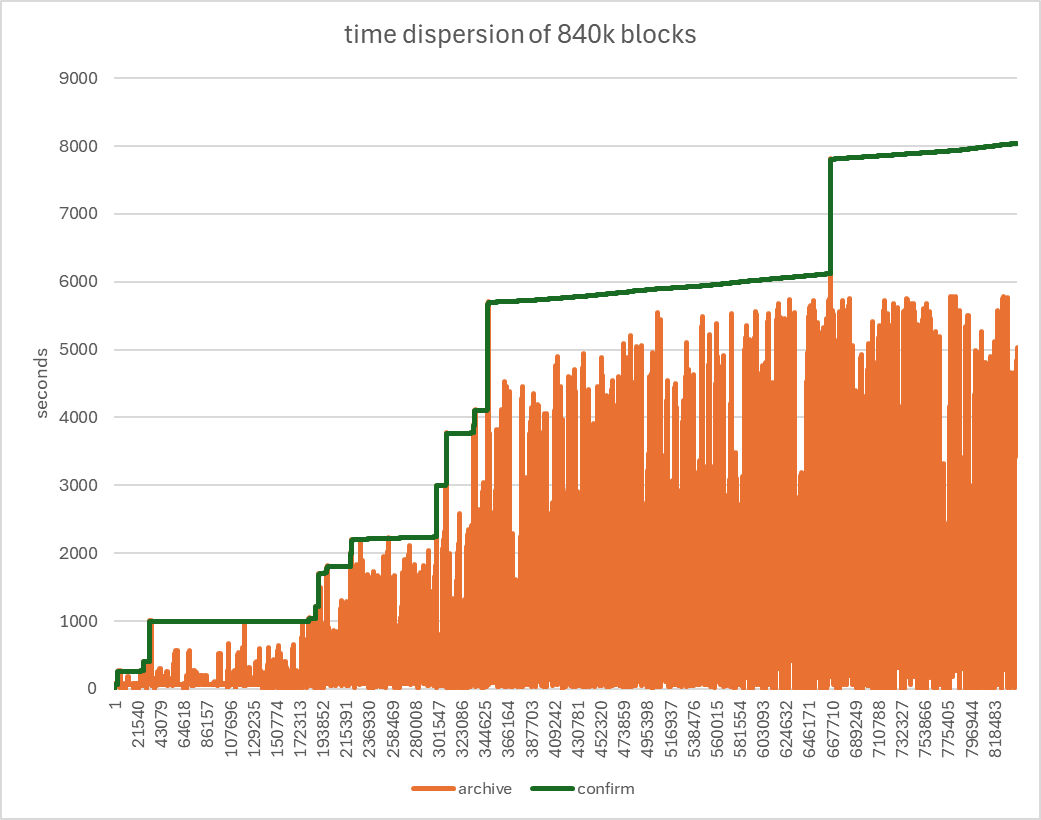
evoskuil16:27
Notice that confirmation time is linear in the number of inputs in the confirming block, so it trends up as blocks get bigger. But not as a function of the total store size, and block inputs are bounded, so constant time in the size of the chain.
(edited)
pmienk19:54
Topic: Dev Weekly Status
Time: May 9, 2024 01:00pm Pacific Time (US and Canada)
Join Zoom Meeting
https://us05web.zoom.us/j/87666370902?pwd=bEZDUlJ0MGJ5V3dVMUhVdHl5QzdFdz09
Meeting ID: 876 6637 0902
Passcode: 85U0bF
evoskuil22:14
So I decided to start running with inbound connections, and with the moving download window. The download stalled at 349,999 blocks (window of 50k at a time). Turns out one channel is still holding onto block hash, and of course it's the one inbound channel. Inbounds shouldn't have been obtaining work, so that's an issue. And since they aren't performance tracked, they don't get purged when they stall. As soon as I suspended all channels and then restarted, the block was obtained instantly from another channel and progress continued normally.
Friday, May 10, 2024
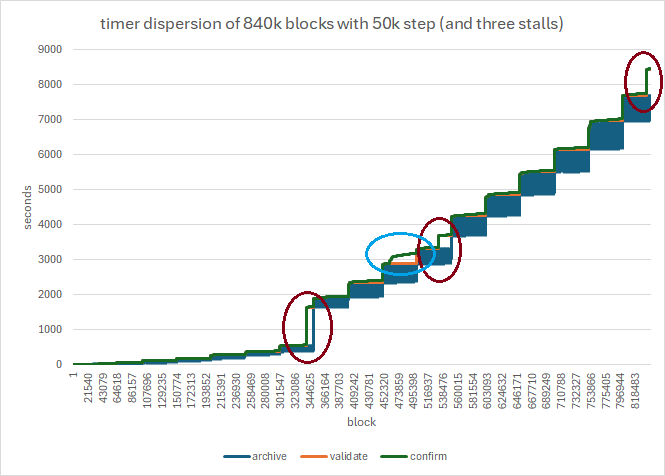
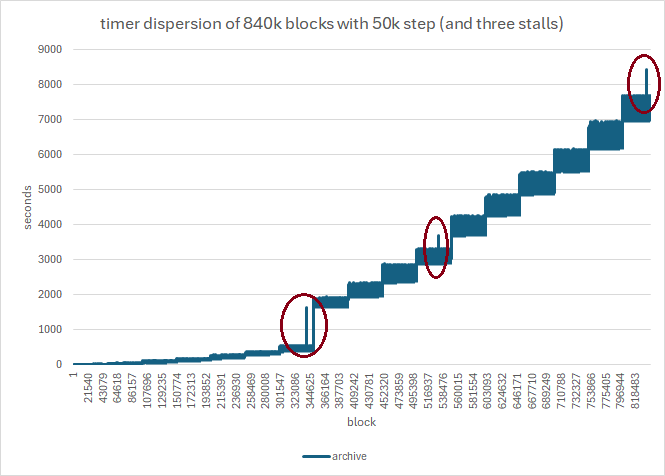
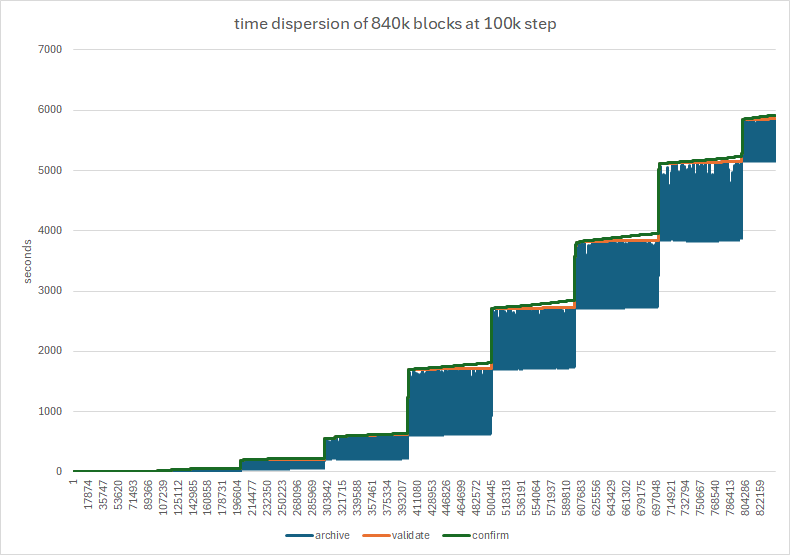
This is pretty awesome outcome from work today to finish the moving download window. Prior to this the node was downloading all blocks concurrently, as shown in the image from earlier today. This can lead to arbitrarily long delays in validation and confirmation, which have ordering requirements. If block 1 is downloaded last, that a bad day. The download window exists to resolve that problem.
These are actually the same graphs as the ones posted previously, but with a 50k block window applied to the run. All blocks in the window must be downloaded before it proceeds to the next step. This is clearly visible in the graphs. What stands out clearly in the lower graph, of just block archive times, is three spikes (circled). These are the result of the run allowing one incoming channel. Only outgoing channels are performance managed, so three different channels popped up and grabbed work but didn't do any. This led to a long stall, until I noticed it and reset all channels (as described above earlier). The upper graph shows bypassed validation and confirmation chasing these steps as expected.
evoskuil02:03
Subtracting out the three spikes we get a confirmation time that's around 1:46, which is close to optimal (this included the full Electrum address index). There is another noticeable deviation highlighted in blue. This is an increase in confirmation time only, and is a consequence of large c++ compilations consuming nearly 100% CPU time during that period. However that has no material impact on the overall time.
Also interesting is the height/thickness of each step. This is a consequence of the average block size within the step, with the expected sharp inflection point around 300k. Blocks go from about 1kb to 1mb - 3 orders of magnitude, and continue to increase gradually from that point.
This optimal window size(s) will require some tuning and the config automation, but even this works very well. It's a small tradeoff in total time in order to practically eliminate the possibility of confirmation delay caused by late blocks. Also forgot to mention above that I performed a backup at some point in the last 10 minutes, which is not even discernable on the graph. Shutdown time was 61 seconds - for a single full chain run with an extra 115GiB for Electrum!
evoskuil05:45
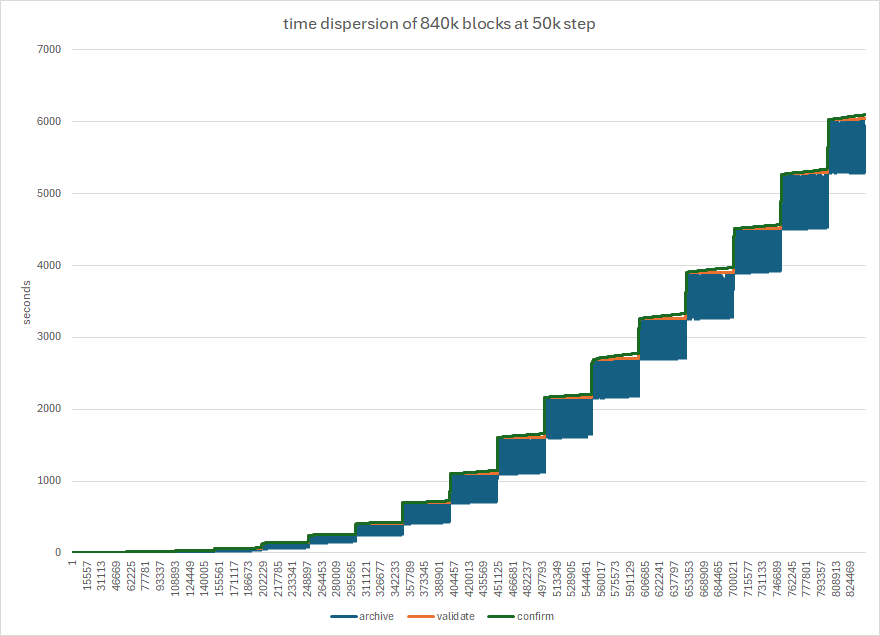
This is a clean 840k block run without the Electrum index, which came in at 1:42, very consistent with the expected slight improvement over the above 1:46 (corrected) run.
evoskuil05:51
You can see the tight consistency imposed by the steps, despite internet connectivity to machines with significant performance variation. There was no backup during the run, and store close took 187 seconds. Memory utilization during the run was about half of that during un-stepped runs.
evoskuil08:26
This is the same run but with 100k steps. During the run I inadvertently suspended all network channels for about a minute, which creates some whitespace in the 700s. This was faster, but with a little more volatility, as expected. Total time about 1:38 (corrected). One minute for headers, 45 secs for store shutdown. This also used about twice as much RAM as the 50k step.
(edited)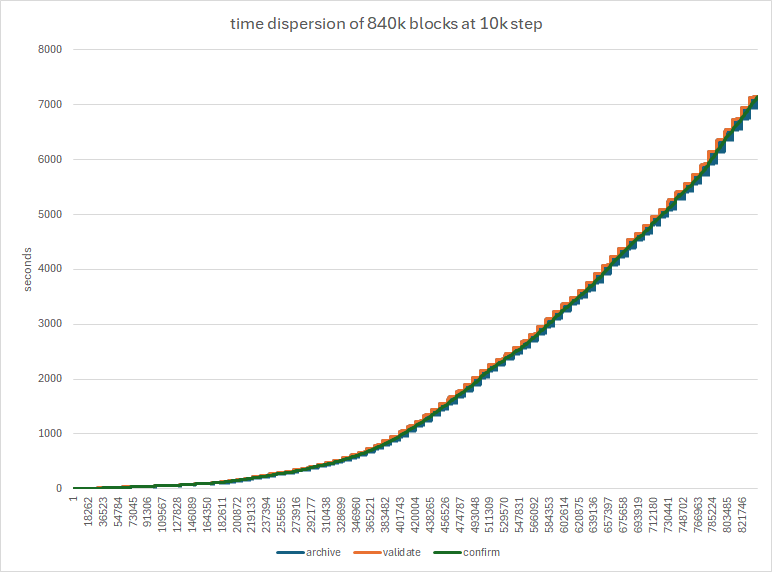
Same run with 10k steps. Total time 1:59 plus one minute for headers and 160 secs for shutdown. Increasing cost with diminishing returns as steps get smaller. Somewhere between 50-100k steps seems optimal.
evoskuil17:01
The above runs are all with 200 outbound peers configured, and the initial block inventory size set to the step size divided by 200.
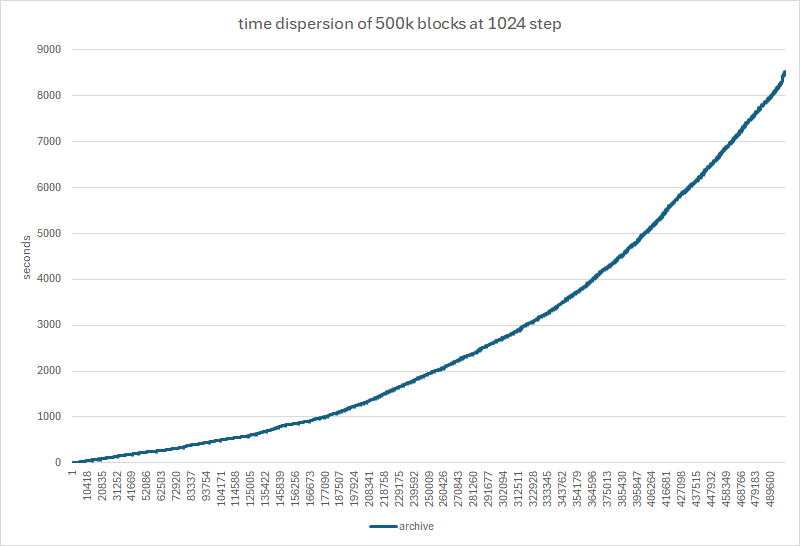
Core uses a fixed step of 1024, 10 outbound peers, and 16 block inventory. There is no management of peer deviation, or rapid connect. If a peer "stalls" for 2 seconds it is dropped and replaced. Out of curiosity I've set up a run for the closest comparison, with a step of 1024, inventory of 16, and 10 outbound peers.
evoskuil18:05
As a general rule of concurrency, you don't want to spend more time chopping up the work than the benefit you get from it. This is why the inherently two channel RIPEMD hash doesn't get implemented with concurrency - it's orders of magnitude slower. Core's implementation isn't really concurrency, it's more like a read-ahead cache. That benefits validation, but reducing CPU starvation, but not download.
evoskuil19:40
2:40 into the Core-equivalent sync, BN is tracking close to (actually ahead of) what I observed with Core on the same machine. It's at block 530k, which is about 26% of the wire serialization. At that point the 50k step config above had already completed all 840k blocks an hour earlier.
(edited)evoskuil20:37
I stopped this at ~block 500k (about 1/4 of the chain bytes by the wire serialization) as it was going to take about six hours longer and had already taken 2h21m. The validation and confirmation lines are hidden since they are essentially coincident at this scale.
evoskuil20:46
This explains why Core is so slow even with assumevalid and plenty of WAN, SSD, CPU available. Concurrency is severely constrained by the implementation.
Saturday, May 11, 2024
evoskuil14:18
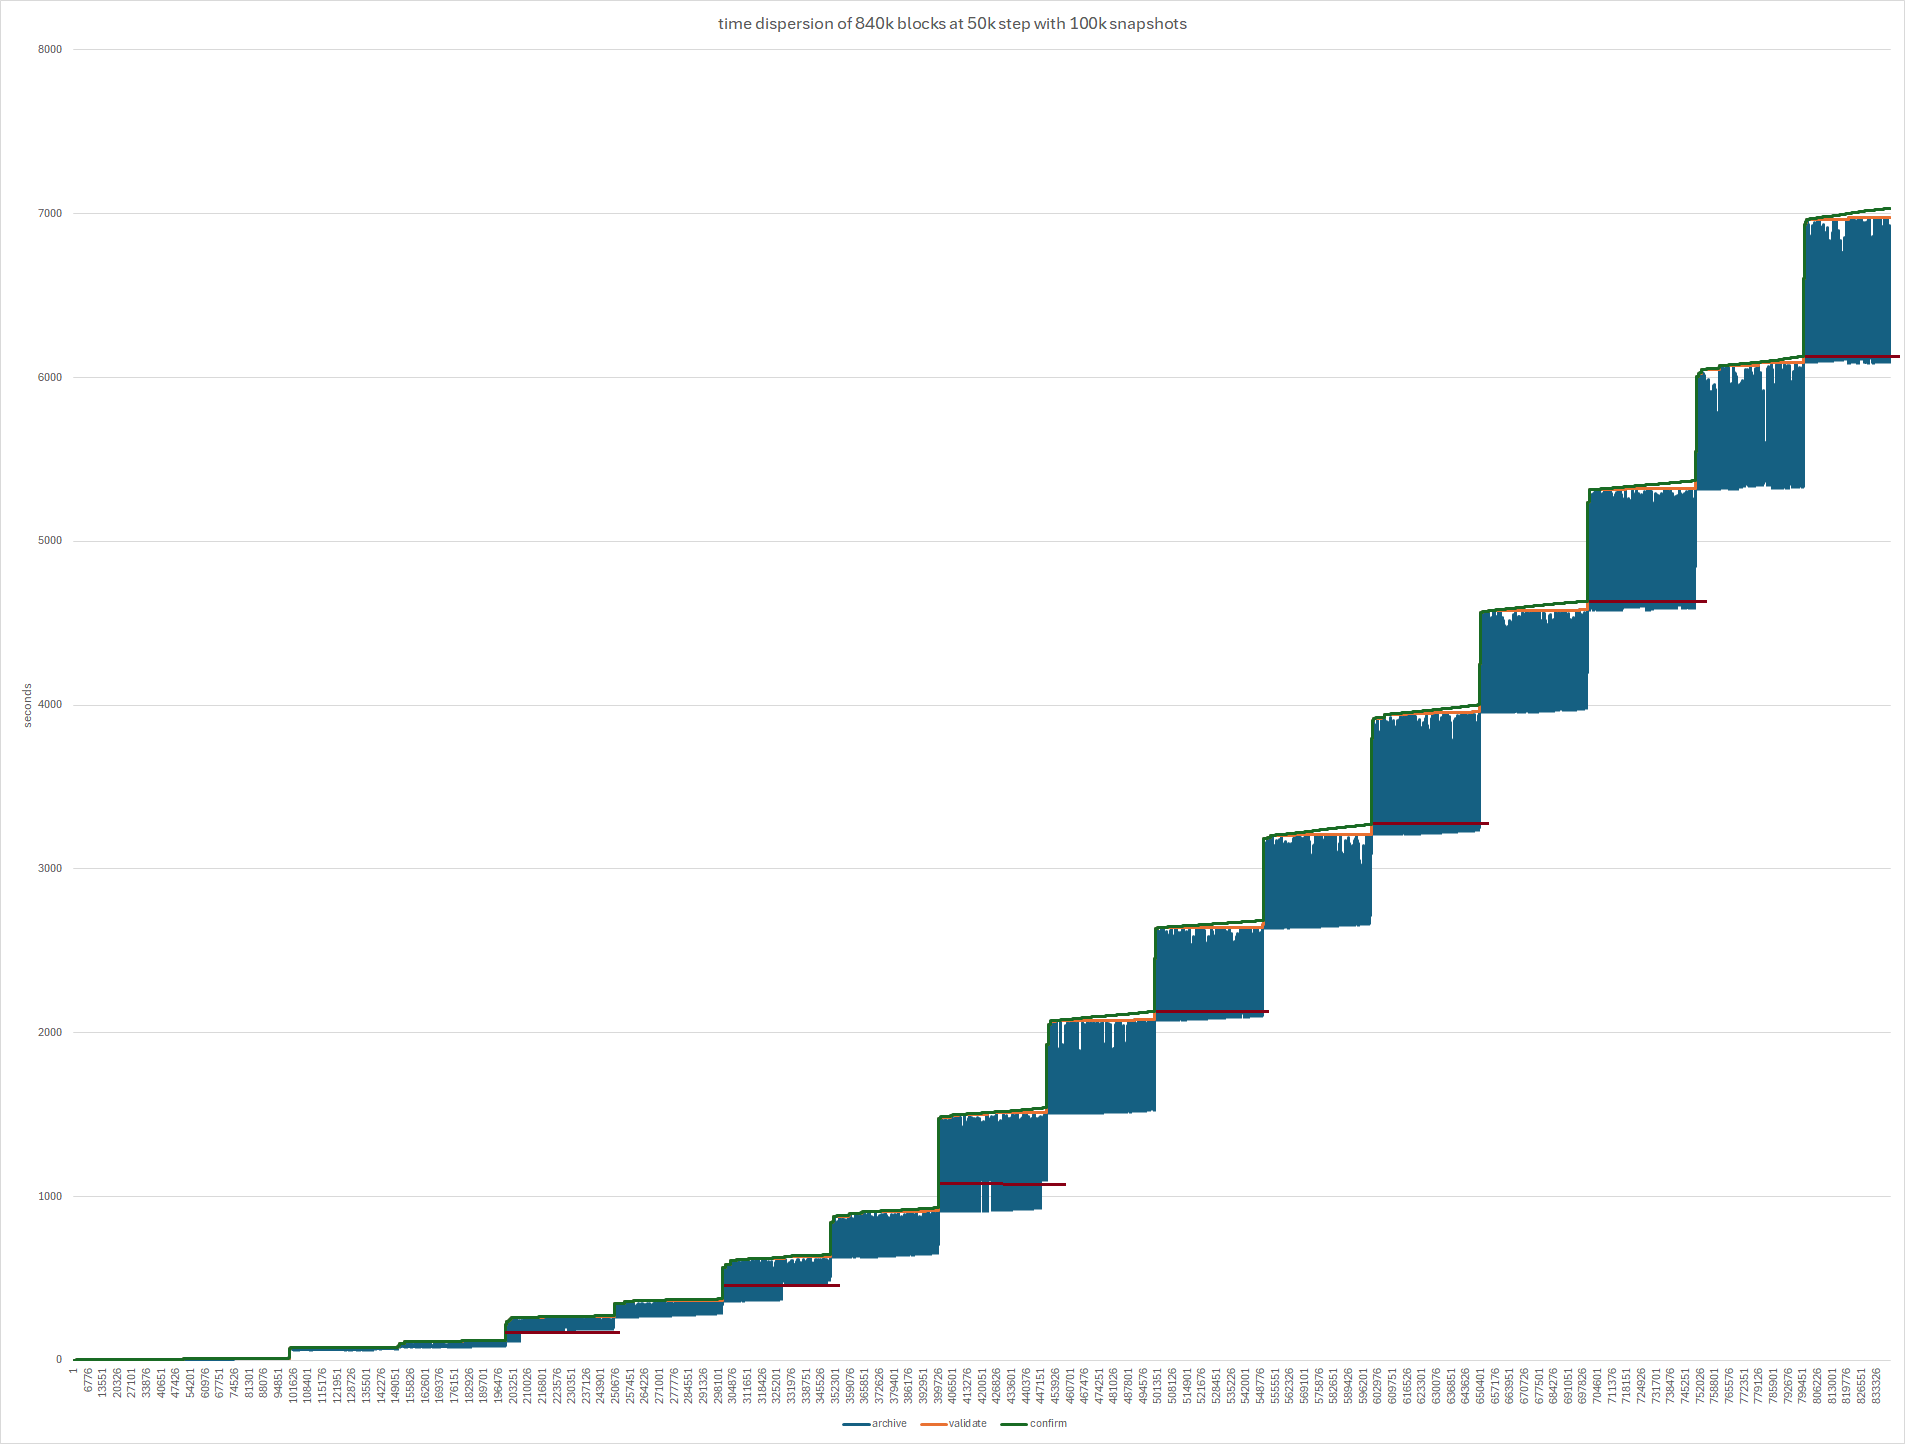
This is the 50k step run but with snapshots every 100k confirmed blocks by height. This isn't a very rational target for snapshot automation given that the first three take longer than the synch they are backing up. But it's a good measure of overall cost. The run took 1:58 vs. 1:42 without the snaps. So 16 minutes for 8 snaps, average 2 minutes each. The image shows a red line under every other step, which is a best guess at estimating where the snap cost shows up.
evoskuil17:31
With 50k steps, 200k snaps, Electrum addressing: 1:54 - so about 9 minute snaps cost, or average 2:15 each (higher due to lower frequency and much more data with Electrum). 2:57 shutdown time.
Sunday, May 12, 2024
evoskuil12:47
Worked off some more technical debt yesterday, and also added the ability to automatically (1) create the store at startup if missing, and (2) snapshot the store at disk full.
There is always enough space to snapshot as long as there were previous snapshots, since they are always the same size, and they rotate between two. Verified handling of disk full on automatic backup and store create as well.
These add to the existing ability to automatically snapshot while running, automatically detect corruption due to uncontrolled shutdown, preserve an unexpected store fault through shutdown, and automatically recover from snapshot when a fault is detected at startup.
(edited)I also recently automated the sizing of inventory allocations to each peer. This gets dynamically adjusted during the run, but helps to have a good starting point. So one less thing to configure for optimal runs. I’m trying to get optimality fully automated, based on hardware sizing and other aspects that can be automated.
I’ve got a couple more things to implement on fault tolerance before moving on to validation concurrency. (1) timer to poll disk space once a disk full condition is hit, so resume can be automated. (2) create a more optimal schedule/criteria for snapshot automation.
Wednesday, May 15, 2024
evoskuil05:45
The schedule/criteria for automated snapshots is implemented. This consists of two configuration options, both intervals - bytes and confirmations. The node can very rapidly obtain the byte sum of all store headers and bodies. This is checked for each block arrival and the difference from startup is obtained. When this exceeds configured it backs up and resets the startup value. This can lead to a larger than expected gap if the node is stopped and then started, though this is acceptable. If a snapshot is taken close to stop (which should be expected) then this is moot.
evoskuil05:53
As validation/confirmation is costly when not bypassed, the node tracks a configurable number of blocks above the top milestone/checkpoint as an additional snapshot interval. An 840k milestoned Electrum sync takes 1:35-2:00 with no steps, 1:45 (high predictability) with 50k block steps, and 1:55 with that and four snapshots (with 1/4 size memory map file preallocations and 10% subsequent growth).
The timer for disk full polling has been added, and an available space file system utility added and tested. Just need to store/access the values and do the math to determine space requirement. Hopefully that will be complete tomorrow.
Also did a lot of bn command line, config file settings, and runtime options work - for consistency, completeness and readability. The bn executor isn't part of the libraries, but is getting pretty big and is due for a day of refactoring. Command line options are:
$ bn --help

Usage: bn [-abdfhiklnrstvw] [--config value]

Info: Runs a full bitcoin node.

Options (named):

-a [--slabs]         Scan and display store slab measures.
-b [--backup]        Backup to a snapshot (can also do live).
-c [--config]        Specify path to a configuration settings file.
-d [--hardware]      Display hardware compatibility.
-f [--flags]         Scan and display all flag transitions.
-h [--help]          Display command line options.
-i [--information]   Scan and display store information.
-k [--buckets]       Scan and display all bucket densities.
-l [--collisions]    Scan and display hashmap collision stats.
-n [--newstore]      Create new store in configured directory.
-r [--restore]       Restore from most recent snapshot.
-s [--settings]      Display all configuration settings.
-t [--test]          Run built-in read test and display.
-v [--version]       Display version information.
-w [--write]         Run built-in write test and display.
Log output starts with log configuration. Note that all logging can be excluded by compilation, including anything that contributes to generation of each message. So this emits not only the configured defaults (which are configurable via settings and can be toggled at runtime) but also the compilation state for each:
2024-05-15T05:58:16Z.0 Log system configuration...
2024-05-15T05:58:16Z.0 [a]pplication.. compiled:1 enabled:1.
2024-05-15T05:58:16Z.0 [n]ews......... compiled:1 enabled:1.
2024-05-15T05:58:16Z.0 [s]ession...... compiled:1 enabled:1.
2024-05-15T05:58:16Z.0 [p]rotocol..... compiled:1 enabled:0.
2024-05-15T05:58:16Z.0 [x]proxy....... compiled:1 enabled:0.
2024-05-15T05:58:16Z.0 [r]emote....... compiled:1 enabled:0.
2024-05-15T05:58:16Z.0 [f]ault........ compiled:1 enabled:1.
2024-05-15T05:58:16Z.0 [q]uitting..... compiled:1 enabled:0.
2024-05-15T05:58:16Z.0 [o]bjects...... compiled:0 enabled:0.
2024-05-15T05:58:16Z.0 [v]erbose...... compiled:1 enabled:0.
(edited)
The available runtime settings are also emitted on demand as follows:
2024-05-15T06:00:21Z.0 Toggle: [a]pplication
2024-05-15T06:00:21Z.0 Toggle: [n]ews
2024-05-15T06:00:21Z.0 Toggle: [s]ession
2024-05-15T06:00:21Z.0 Toggle: [p]rotocol
2024-05-15T06:00:21Z.0 Toggle: [x]proxy
2024-05-15T06:00:21Z.0 Toggle: [r]emote
2024-05-15T06:00:21Z.0 Toggle: [f]ault
2024-05-15T06:00:21Z.0 Toggle: [q]uitting
2024-05-15T06:00:21Z.0 Toggle: [o]bjects
2024-05-15T06:00:21Z.0 Toggle: [v]erbose
2024-05-15T06:00:21Z.0 Option: [b]ackup the store
2024-05-15T06:00:21Z.0 Option: [c]lose the node
2024-05-15T06:00:21Z.0 Option: [e]rrors in store display
2024-05-15T06:00:21Z.0 Option: [g]o network communication
2024-05-15T06:00:21Z.0 Option: [h]old network communication
2024-05-15T06:00:21Z.0 Option: [i]nfo about store display
2024-05-15T06:00:21Z.0 Option: [m]enu of options and toggles
2024-05-15T06:00:21Z.0 Option: [t]est built-in case
2024-05-15T06:00:21Z.0 Option: [v]ersion information
2024-05-15T06:00:21Z.0 Option: [w]ork distribution display
2024-05-15T06:00:21Z.0 Option: [z]eroize disk full error
The usability features are already saving me tons of time in testing and debugging, since I can often corrupt the store by halting it in the debugger or creating a bug, but then it just comes right back from snapshot in a minute or two. The runtime diagnostics for the tables are essential for sizing and bucketizing. And the dynamic log leveling and other info helps a lot.
Also, with the addition of stepped parallel block download the times have become very consistent - within a minute or two difference between runs when syncing the entire chain with Electrum over the Internet. Reliability remains extraordinary. The only issues I ever see are ones that I introduce with new code.
(edited)😮 1
Thursday, May 16, 2024
pmienk19:54
Topic: Dev Weekly Status
Time: May 16, 2024 01:00pm Pacific Time (US and Canada)
Join Zoom Meeting
https://us05web.zoom.us/j/87666370902?pwd=bEZDUlJ0MGJ5V3dVMUhVdHl5QzdFdz09
Meeting ID: 876 6637 0902
Passcode: 85U0bF
👍🏻 1👍 1
"No copyright restrictions
All of the NaCl software is in the public domain."
That's Frank Dennis commenting, who runs libsodium.
Can you post the link where they removed it?
It was discussed with H Pieter way back in 2014 when it was added.
(edited)evoskuil23:06
I think the resolution might be to embed tweetnacl into libbitcoin protocol and just let the linker sort it out.
6 replies · pmienk, evoskuil · last May 17, 2024
pmienk00:38
Don't think that'll work given the source and config changes. Likely we would have to pass the sodium detection to even get to the calls under the assumption that tweetnacl provides interface and initialization parity. Given that there's conditions that involve differentiated initialization calls for windows I think source changes in zmq will be necessary
evoskuil01:00
I see, it's not the Tweet NaCl license that's at issue. A few years back they solicited authorization for all contributors to grant relicensing (I granted it years ago). It was the guy who originally added it, I recognized him from the commit, so they pulled out that work.
evoskuil01:03
Jeesh, they are still carrying and updating my "/deprecated" msvc files (all the way back to vs2010).
evoskuil01:04
The commit is almost entirely build system. Seems like the actual C/C++ source change is compatible with the header swap. But yeah, lots of build system shit.
Friday, May 17, 2024
evoskuil01:11
As we discussed today, I've completed the disk polling at the point where we suspend for disk full. This pauses and restarts automatically as space is insufficient and made available. I also added a guard against obtaining a map read/write accessor if the store enters a fault state (basically if an mmap API fails during remap), and the fault results in a flush.lock turd on shutdown (as with any process termination), which forces an automated restore from snapshot upon nest startup.
So I'll be ready to move into validation concurrency starting next week. I'll be doing some more runs in the mean time. I end up syncing several times a day as it is.
I just obtained a 2.5Gbps NIC for the PC and have had a 2.5 Gbps modem, router, and 10Gbps wiring. 2.0Gbps service should be switched over in the next week, so maybe we'll actually see 1 hour full chain sync, and with Electrum indexation!
(edited)🎉 2
Sunday, May 19, 2024

Shashank Shekhar Singh13:40
Hello everyone!
I am Shashank Shekhar Singh, a sophomore from IIT BHU. I have also been selected as a contributor for the libbitcoin's project in SOB. I would like to mention that I have previous experiences in SQLite database and C++ along with some projects on sqlite3. I started exploring the domain of Bitcoins and Web3 2 months back, and have now got a considerable understanding of the fundamentals. It would be great to work under you guys along with @Tanay Raikhere on this project.
🔥 1👋 3👋🏾 1👋🏻 1

Wednesday, May 22, 2024
evoskuil00:28
I picked up 4 x 8GiB RAM cards, so that I'll be able to test 8/16/24/32GiB configurations. Should have that and my 2Gbps WAN up and running tomorrow. I've moved on to concurrent validation. As a rough approximation, this process...
- deserialize block
- read block/tx previous valid/invalid states
- populate all tx input prevouts
- validate all txs/block (accept/connect)
- write validation metadata for each tx/block
- read block previous confirmable state
- confirm each tx/block (maturity, spent, double spend)
- write confirmable metadata for block
- associate confirmed txs with their block
- organize block (index height)
...takes about 1 second for the largest blocks when performed entirely sequentially. If we (pessimistically) extend that across all blocks (early 300k blocks are orders of magnitude faster), that's 233 hours (10 days). If we (optimistically) divide that by my 64 cores, it's 3.65 hours. Realistically I expect that to be closer to 2 hrs.
(edited)5 replies · jungly, Tanay Raikhere, evoskuil, Shashank Shekhar Singh · last May 22, 2024

jungly07:49
@Tanay Raikhere and @Shashank Shekhar Singh - can help here. They are also building the master branch on their machines to get some more numbers on the rate of downloading and validating the chain on their machines.
Tanya, Shekhar, if you have any questions configuration etc, let us know.
👍🏻 1👍 2

Tanay Raikhere07:56
Hey, I and Shashank we both tried to build the master node, but since both of us had only 256 gigs of storage, the sync came to a halt pretty quickly.
So I had an old system lying around, but that too has low specs keeping the sync speed really slow.Moreover, that system has only 500GB storage, and the full blockchain sizes ~600Gb. Therefore, I am thinking of getting a pre-owned cheap PC with at least 1TB of storage for the full node operation.
(edited)Shashank Shekhar Singh17:33
@Tanay Raikhere, Actually I have a 500gb ssd. I have a 1tb hdd, on which I have run the node using the bn command and it showed: "2024-05-22T17:30:35Z.0 Node stopped successfully."
evoskuil17:41
The full chain cannot be stored in 500GiB. It's about 750GiB with Electrum and Neutrino indexes and about 600GiB without them. An HDD is very slow, but will of course function.
(edited)evoskuil00:34
I did perform the above sequence and it completed 750k blocks in 4 days, and will have finished 840k in 5 days, so more realistically the current average is about .5s per block. So it should come close to the 2 hour target.
(edited)evoskuil00:48
This is without shani or avx512, which should reduce CPU cost significantly (5x faster sha256, 2x faster merkle root).
evoskuil15:43
The full validation and confirmation from genesis completed as expected with no validation errors.
evoskuil18:35
https://github.com/libbitcoin/libbitcoin-network/commit/fbc67ffe73d34175c989edec41e17704c96612e3
Can't we all just get along? 🤔
😄 1
evoskuil21:49
Just hooked up my 2Gbps WAN and the first sync I've done, without optimizing config, is on track to complete in 45 minutes. Half the time I consistently see on the 1Gbps network (no Electrum index, steps, or snapshots).
👉🏻 45 minutes 👈🏼
(edited)😲 4
For those of us who aren't so good at math, that's perfectly linear scale.
🤣 1
Thursday, May 23, 2024
evoskuil02:57
Didn't get 45 minutes, just over an hour. I'm getting about 1.5Gbps utilization, so only about 50% faster vs. 100%. I varied thread count, peer count, and step size but without much difference.
I believe that the download is getting so fast that sequential validation/confirmation is now dominating (despite being bypassed by checkpoint/milestone in these runs). The time to confirm all txs and blocks was about 30 minutes last I checked it independently. I noticed this was running for about 15 minutes after download completion (which is why it ran longer than the half way trajectory). If that time had been cut in half as well it would have hit about 45 minutes.
evoskuil03:04
Bypassed validation/confirmation marking can however be run concurrently, as no order is required. So I'll eventually add these updates to block writes, which execute on independent channel threads. Then we can just update the height index sequentially to provide more consistent query (which is fully available during sync, which is perpetual).
evoskuil03:55
One of the nice things about the append-only relational design is that these updates only append relatively small independent tables, and require no additional reads. So running this concurrently will have little performance impact - just like the massive Electrum addressing. Also, performing this during block write eliminates the need to look up the tx surrogate keys, since they are in hand.
💥 2
pmienk19:05
Topic: Dev Weekly Status
Time: May 23, 2024 01:00pm Pacific Time (US and Canada)
Join Zoom Meeting
https://us05web.zoom.us/j/87666370902?pwd=bEZDUlJ0MGJ5V3dVMUhVdHl5QzdFdz09
Meeting ID: 876 6637 0902
Passcode: 85U0bF
👍🏻 1👍 2
Friday, May 24, 2024
evoskuil04:17
Ran a couple more full chain syncs after getting my new router installed. Hitting about 90 minutes with three snapshots (4+3+3=10 minutes) and 50k steps (adds about 10 minutes).
Also added a
system::ceilinged_multiply() to /math for use supporting a new database::system_memory() utility. This will facilitate the config automation necessary to optimize based on total system RAM.Also a good first discuss on the Summer of Bitcoin work by @Shashank Shekhar Singh and @Tanay Raikhere to implement the
database::query class on SQLite!👍🏾 1👍 2
Will be getting back to parallelized validation tomorrow.
Saturday, May 25, 2024
evoskuil22:50
Just got my very first timed tests of parallel block validation. 100% CPU utilization from start to finish, not even a tiny gap. Downloading and validating what is downloaded.
(edited)💥 1
evoskuil23:08
Lots of numbers, and I'm performing no management of the validation work queue - just reading and populating prevouts for every block in order as that order is obtained. Presently doing blocks 300,001 -> 400,000.
It took 9.5 minutes to download, check and store the blocks while at the same time reading them out of the store in order, populating all of their prevouts, validating all txs, and writing confirmation (not currently checking confirmability)....
By the time block 400k was stored, 35k of the 100k pending blocks had been validated!
Download of course is slowed by maybe 50% due to full CPU utilization (equal priority, with network at 16 logical threads and validation at 64). But at the last download there were 65k buffered blocks - tens of millions of txs. Memory got no higher than 30%, which is basically a normal run. Once the node hit 50k blocks, CPU shot from 30% (with only 600 blocks validated) to 100% and stayed there until completion (100k).
(edited)This is because of the download window of 50k. There was a gap at 300,584 until almost 350,000. So validation was a trickle until then. And yet it got 35k blocks validated while the next 50k window was completing.
The full 100k run took 20 minutes and validated about 105M txs.
Decreasing the download window can allow blocks to start validating in bulk much sooner. For example, at 25k window would have started bulk validation 50% sooner (5 vs. 10 minutes) and would have therefore completed the total run in 15 vs. 20.
All that is necessary during validation is to avoid gaps, and racing ahead of the validator beyond ensuring no gaps only hurts time as it consumes more memory and will ultimately require more reads.
So in addition to managing the download window, we need to manage the validation buffer. Presently it takes everything that has been downloaded, in order (no gaps). And then validation ensues across txs (not blocks) in that entire space by posting each tx to the asio queue and letting asio sort it out. Completion handlers are provided per block, using a shared pointed that each tx of a block closes over. So the last tx for a block to complete invokes the block validation handler. I'm still not validating the block portion, but that's tiny and the handler is in place.
The buffer should really be tracked to be large enough to prevent CPU starvation and to delay download so that blocks don't need to be read from disk. In other words, feeding back into the download window when we are validating. This should be straightforward.
(edited)Of course if we start back up after downloading but not validating we read from disk until there are gaps. This is how it's already working. So I'll run some tests with the store populated but blocks not validated. It should be faster since that's just removing the download/check/store steps. In either case we are presently reading all from disk.
This was just an early peek. Now that I can see it functioning it's time to get back to the things we formerly assumed would work but now we know will work.
One thing that was astonishing was the complete lack of disk activity beyond what we see for download, given that we're reading all blocks off the disk and populating their prevouts. Also memory is no higher than a download only run - even with a huge about of work buffering and number tx object help on the heap. It's far more than we will need to keep even a 128 core box from CPU starvation.
This lack of disk activity is a consequence of the data being memory resident in the tables. My RAM operates 20 GiB per second and the queries, streams, and deserializations are very efficient. The low RAM increase is probably just the results of the materially slower downloads, offset by the much higher object-based heap consumption.
evoskuil23:54
Running 400-450k now, with a 10k download step. That caused all downloads to complete in 10.5 minutes (blocks orders of magnitude larger in this range from prior) while validation was accelerated as expected, with 29k out of 50k blocks completing in that 10.5 minutes. So almost 60% complete now vs. 35% in the previous run with the 50k vs. 10k step. Still 100% CPU from the point where the first step completed.
(edited)It's pretty amazing to watch this thing validating txs across up to 10k fairly large blocks concurrently.
Now that the download is complete I can see that this 50k blocks is exactly
(edited)78,279,395 transactions for an average of 1,566 txs per block. In the first almost 300k blocks the average is closer to 2 txs/block.Sunday, May 26, 2024
evoskuil00:01
Ok, that 50k run completed overall in 21 minutes. Peak RAM 38%, almost no disk activity except for very limited periodic table flushing. CPU pegged 100%. Console app responsive to input the whole time.
(edited)evoskuil00:07
It's also very nice to see under this intense loading, that there are no adverse behaviors or failures - validation/consensus or otherwise. I can continue to use the desktop as it runs, with little impact.
evoskuil00:13
Ok, on to 450-500k. Reduced network threads/peers to 8/100 from 16/200, reduced step from 5 to 10k blocks. This caused full CPU utilization to jump to 100% at 30 seconds into the run (and is staying there), vs. 9.5/10.5 mins in previous runs. So shifting more power from network to CPU, especially as blocks are getting bigger and there's no size-based throttling yet.
(edited)evoskuil01:13
The full chain is
1,009,048,114 txs so at that tx rate the full chain would complete in a total of 4.5 hours - download with validation. Though there are still a few +/- caveats. But still, a great ballpark to be in.evoskuil01:35
Working the next step, 500-550k, I dropped the step down to 1k blocks. This has led to regular gaps in CPU utilization as the read ahead is insufficient to prevent CPU starvation.
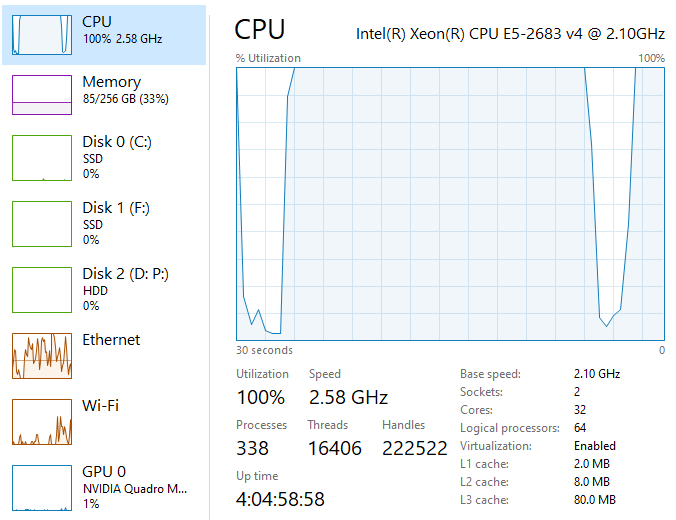
This gaps are just the CPU getting ahead of the network at a very small (1k) download window.
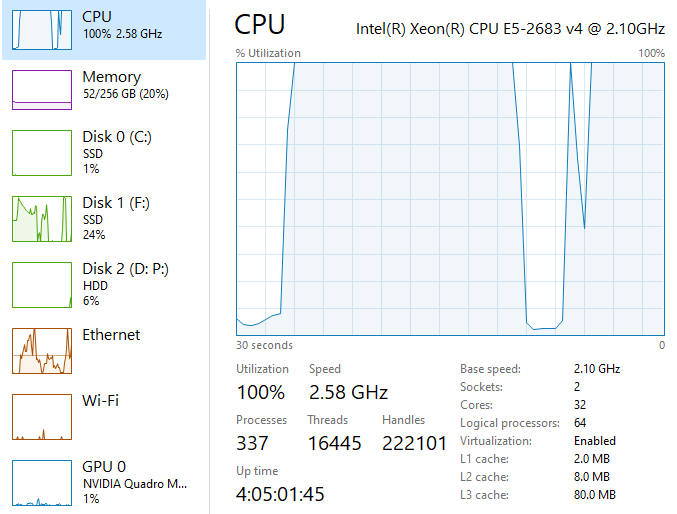
This also happens as the result of disk flush, which can be seen here. That results from the validation being blocked from writing its final status to the store as the memory is remapped. This can be avoided entirely by buffering completion handlers such that subsequent validations are not waiting and can proceed both without network and without disk.
It should be obvious that with twice the number of cores, validation would complete in half the time.
(edited)evoskuil02:22
Last run completed at a higher rate, despite the CPU starvations.
(edited)182,702,366 txs in 57 minutes. So now at 466,297,403 txs total, or close to half way done, and total time is 2:10. I'd expect it to complete in 4:30 at this rate. Increasing the step to 2,500 blocks and running 600-700k now.🔥 1
evoskuil16:28
Slightly faster rate from 700-800k,
199,398,844 txs in 63 mins. Total time to 800k about 4:15.evoskuil16:33
The final 40k blocks (to block 840,000) or
(edited)122,066,968 txs took 27 minutes. That was the fastest rate yet, at 4,520,998 txs/min vs. previous runs at around 3,100,000 txs/min . I attribute this to two things. (1) a lot of unspendable outputs (jpegs) that don't get validated or have signatures, and (2) we don't execute taproot scripts, so these signatures aren't getting verified. So this run should have really been closer to 35 minutes.🙌 1
So that puts the full chain, validated in 13 start/stop segments, at 5 hours. There are certainly inefficiencies in the first take, including the cold starts, lack of avx512 machine, lack of sha-ni implementation, non-management of validation buffer. But we also aren't yet validating the blocks (tiny by comparison, maybe 1 minute for the full chain) or verifying confirmability (at least 30 minutes for the full chain).
evoskuil16:50
However, to keep this in perspective, Jameson Lopp's sync with validation of bitcoind to block 819,000 took 8:38. Linear projection to 840k puts that at 8:51 vs. our 5:00.
There are material differences in the comparison, such as the fact that his tests are performed on a LAN against two fully-synced nodes whereas mine have been over the Internet (disadvantage), and that both his RAM and CPU speeds are faster than mine (2666MHz/2400, 3.1GHz/2.1) (disadvantage), but I have more RAM (256GiB vs 32) and more cores (32 dual vs. 6) (advantage). A better comparison would be running Core directly yon my machine with full validation. With NO validation it doesn't even get 10% of the chain downloaded in 1.5 hours (when we finish) so certainly adding the significant validation cost won't improve that.
(edited)evoskuil21:41
I dropped my RAM down from 512GiB (I forgot it wasn't 256GiB), to 32GiB and performed another identical run from block 0-300k, and there was no change to the outcome - 11 minutes.
I then dropped my CPU count down to 10 dual (@2.1GHz), which is as close as I can get to Lopp's 6 dual (@3.2GHz). Also my RAM is 2400MHz and his is 2666MHz, so I'll just pretend these are offsetting. But it's close given that we saturate the cores so it's cumulative speed that matters. This same run again took 27 minutes.
evoskuil21:50
The indifference to RAM and the CPU dependence makes sense, though I went form 32 dual cores to 10, which should have increased the run from 11 mins to 35 (not 27). So we made up for it somewhere else. But it's close and makes sense.
However, in none of these 0-300k runs did we get memory bound. Once that happens the number get bad, and that happens pretty quickly at 32GiB RAM above block 300k due to the need to read all blocks and prevouts for validation.
In the run from 300-400k with RAM at 512GiB it's 20 minutes. At 160GiB RAM it's 21 mins, basically the same since we don't get memory bound.
But in the 400-450k runs with RAM at 512GiB it's 20 minutes, but 60 minutes at 32GiB RAM - with heavy thrashing.
evoskuil22:58
Also ran the 10 dual core run with 128GiB RAM and it was 26 minutes, so not materially difference from the 10 dual core run at 32GiB RAM, which was 27 minutes. So again, as long as we aren't memory bound, it's all about the number/speed of cores.
Monday, May 27, 2024
evoskuil01:14
Also looking at some non-validation runs with lower resources. At 10 (vs 32) dual cores, the sync time increased from 1.5 to 3.0 hrs, with CPU averaging about 95% (with the same 16 network threads configured). This is at 128GiB RAM, so not memory bound until last 100k blocks, then started thrashing, or would have finished around 2.0 hrs.
(edited)evoskuil07:32
After making a few simple changes in the database code, we're now syncing (no validation) at near full bandwidth capability on a 32GiB/10core machine (equivalent to Lopp's benchmark platform). Basically I was able to eliminate thrashing at any level by eliminating all significant reads while writing.
🔥 1
evoskuil07:39
Basically it looks like this for the entire run, apart from periodic rate decay just prior to each window closing) . The disk activity is just flushing downloaded data to the drive. CPU (10 dual) steady at about 85%, RAM (32GiB) steady at about 25%, WAN fluctuating around 1Gbps. Run should complete the entire chain to 840,000 at a total of 90 minutes.
(edited)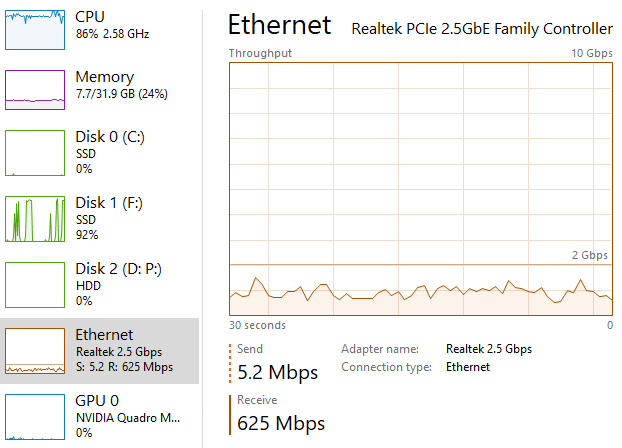
1 reply · evoskuil · last May 27, 2024
evoskuil07:43
The next effort will be to ensure that we can avoid thrashing for validation/confirmation as well for this level hardware.
evoskuil08:55
The above run completed in 1:45, might be closer to 2:00 with confirmation writes. Still awesome for this platform.
Store shutdown, after a complete chain sync, took 12 seconds. Faster with lower RAM.
evoskuil21:22
The latest with the above changes completes on the full power machine in 75 minutes. Getting close to 1 hour full chain sync over the Internet.
Tuesday, May 28, 2024
evoskuil06:43
Spent some time in the performance profiler today. Identified 10% of total sync time as low hanging optimization fruit. Implemented one of those items (script length caching upon construct), which was accounting for about 8% of total sync time. Just fired up the node on my max machine, and it's finally hitting close to my true 2Gbps bandwidth limit.
I started working this problem over 7 years ago, when the full chain was about 450k blocks. At the time I had just purchased this same computer. The only difference is the WAN bandwidth. I just downloaded, deserialized, checked, and serialized to the relational store those 450k blocks in just 10.5 minutes. That's on pace to complete the full chain in less than 1 hour.
🚀 1
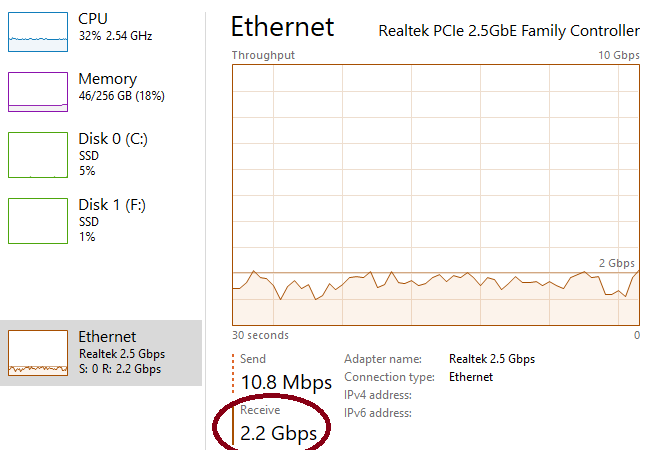
evoskuil07:12
At 2Gbps (the Internet service I pay for) the absolute fastest this can be done is 46 minutes - just accounting for all of the bits in all of the blocks. But there's other necessary traffic. Just passed block 700k at 39 minutes. Should finish at 59 minutes.
evoskuil07:32
Completed in 59.5 minutes! Last block on the bottom row, total seconds on the right:
block_archived...... 826466 3565
block_archived...... 826489 3565
block_archived...... 817480 3565
block_archived...... 826478 3565
block_archived...... 820717 3565
block_archived...... 826474 3566
block_archived...... 826473 3566
block_archived...... 826468 3566
block_archived...... 826469 3566
block_archived...... 828493 3566
block_archived...... 826475 3566
block_archived...... 826477 3566
block_archived...... 802989 3566
block_archived...... 826470 3566
block_archived...... 826471 3567
block_archived...... 826476 3567
block_archived...... 804193 3569
block_archived...... 826499 3572
💯 1🔥 2
That's worthy of a beer.
🍻
👍🏾 1👍 1🎉 1
1 reply · evoskuil · last May 29, 2024
evoskuil07:42
My first download with concurrent validation run was about 5 hrs. That has some huge inefficiencies so let's get that down to one hour also. 🤷🏻♂️
😄 1
evoskuil21:09
This is the lowest end specification run I've ever attempted.
8 dual cores (16 logical) @ base clock 2.1GHz
8 GiB 2400Mhz RAM
2TB 560/530 MBps SATA SSD
7 year old Dell board
2.3Gbps peak measured WAN bandwidth.
It completed a full chain sync to block 840,000 in 2:15.
(edited)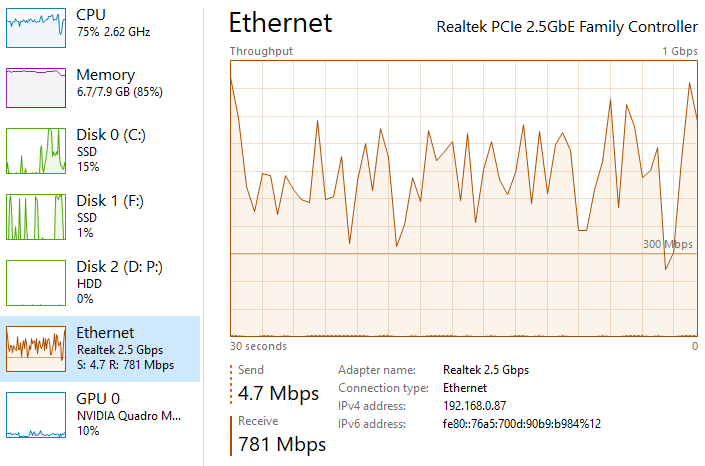
🙌 1
31 replies · jungly, evoskuil · last May 29, 2024
jungly21:57
It'll be fascinating to see how this is impacted when validating and confirming. But, this is simply awesome!
🍻 1
evoskuil22:26
I feel pretty sure that low memory machines will have to validate after sync (because the prevout reads are more costly than the insertion guards that cause thrashing), and certainly higher memory machines will be able to validated concurrently (I've already verified this for the full chain). We can cache block objects in RAM as they come in, and keep the download window small, to prevent re-reading of blocks/txs. But the prevouts would still need to be read.
(edited)evoskuil22:27
But low spec machines are more likely to just rely on milestones with background processing of validation. We can support this while allowing the node to be fully functional.
evoskuil00:12
Another run with max machine, no step specified, 3,599 seconds. So a 50k step as no net cost on the run, but significantly improves ordering and reduces cost of validation while downloading.
And 81 secs shutdown time, which is awesome for ultra hi RAM full chain sync. After getting to about 8% of the chain Core took 15 minutes to stop on this same machine.
(edited)jungly06:50
Interesting point about smaller machines using higher milestones and then validatingv the rest after the download. Does that mean we end up creating two types of nodes? Those that validate the entire chain vs those that validate from a large checkpoint? I understand that's the norm anyway right now.
It'll be interesting to see how long the validation on a smaller machine takes, even if it has fewer cores.
All that aside, the "scaling with hardware" objective is very much happening! 🚀
evoskuil07:09
The difference is that if the node doesn't see the milestone in the strong headers chain, it doesn't get used. It's only there to bypass validation if the milestone is encountered. It doesn't drive you down a certain path.
evoskuil07:10
So the only question is where do you get it. You can save it from a previous validation, never having to validate that chain again.
evoskuil07:11
So if you want to fire up the node and use it for something other than validating your incoming money, you can have it up and fully usable quickly and validation can continue in the background.
evoskuil07:13
Validation time is analogous to download time, but instead of bandwidth you have CPU capacity: Speed x Threads.
evoskuil07:15
So a 64 core machine of 4 MHz cores is 128 times faster validating than a 1 core machine of 2MHz.
evoskuil07:17
I just cranked up the thread count from 16 to 32, after trying several different levels. I was running 16, which was optimal for my 1Gbps network. But 32 is optimal now, and it's running maybe 10% faster. 45-50 minutes?
evoskuil07:26
What's happening is that the things I optimize go away, but the time then gets absorbed waiting on the network, because I'm up against the bandwidth limit. Can only squeeze that grape so much.
evoskuil07:27
But it's really cool to see all of the odd hot spots go away and see the entire report just showing deserialization from the wire and serialization to the disk, with some hashing in the deserialization.
evoskuil07:29
I need to do a run with the memory map sized to the actual tables so that there is no remapping. That will save a few minutes at least.
evoskuil21:24
Close to Pi specs, but not sure if 8 dual is available - but 8 single core with twice the speed is available, which amounts to the same for us. Certainly more RAM is an option, and that's really our biggest issue.
(edited)evoskuil22:22
Just fired up the same config but with 4 dual cores. reached block 400k in 20 minutes, puts it on track to complete at 3:00.
(edited)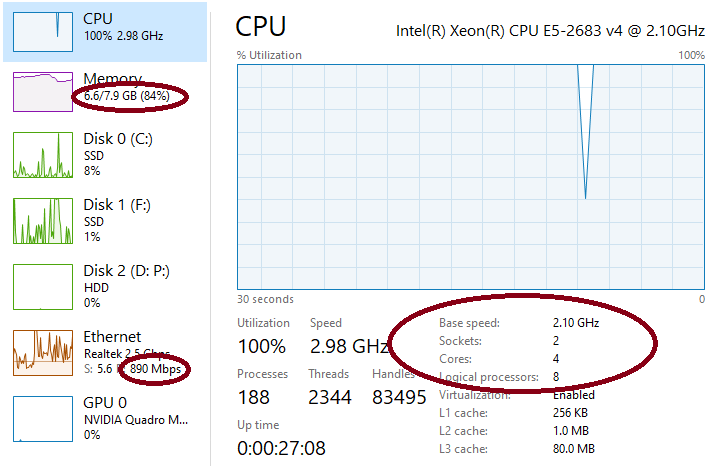
🔥 1
evoskuil22:32
Shutdown time 12 seconds. Consistently I've seen that the amount of RAM dictates shutdown time. With 256GiB and a long running sync, it can take 2-3 minutes, but on 8 GiB it's been 12 seconds both times. That's really nice to see.
I ran the libsecp256k1 benchmarks from the vc++ build that we use (which I maintain in NuGet). This is a 2.5 year old version of libsec, and doesn't have the advantage of ASM optimizations. So the benchmark is about 95-100 usecs per signature verify. Optimal builds can be 10 usec or less on this CPU, so we'll get a 10x improvement in that area over what I measure in validation time.
(edited)Wednesday, May 29, 2024
evoskuil02:03
Profiler helped me catch a trivial 3% of total time being wasted on unnecessary vector allocation. Also saved another percent by caching witness size. A couple more to be had by doing the same for block/tx/input/output.
(edited)evoskuil06:29
Changes saved 1.8%, last run finishing in 58.9 minutes. I can shave a few more minutes off with these types of optimizations, but the big remaining one is shani. Non-Merkle hashing is at least 10% (shani doesn't help Merkle much). Hard to say for sure since there are so many types and calls. But reducing that to 2% might save us around 5 minutes. At that point it's pushing the theoretical limit based on bandwidth.
Then back to the more interesting optimizations around validation!
🙇🏾 1
Shutdown was again 82 seconds.
Thursday, May 30, 2024
pmienk19:43
Topic: Dev Weekly Status
Time: May 30, 2024 01:00pm Pacific Time (US and Canada)
Join Zoom Meeting
https://us05web.zoom.us/j/87666370902?pwd=bEZDUlJ0MGJ5V3dVMUhVdHl5QzdFdz09
Meeting ID: 876 6637 0902
Passcode: 85U0bF
👍🏻 1👍 1